Overall
The market is entering a phase defined by heightened geopolitical risk and mounting concerns over fiscal sustainability, with investors recalibrating their expectations as the earnings season unfolds. The resurgence of long-term U.S. Treasury yields above 5 percent—its highest level since 2008—signals a growing skepticism regarding the federal government’s ability to manage its debt trajectory, especially as deficits expand and inflation remains sticky. Unlike the crisis of 2007, when the 30-year bond yield briefly breached similar territory, today’s environment is compounded not only by the sheer scale of the national debt, now exceeding $31 trillion, but also by the accelerating pace of federal borrowing to fund artificial intelligence infrastructure and other strategic priorities. Investors are no longer reassured by the historical context; instead, they demand higher risk premiums, viewing the 10-year Treasury yield as a barometer of systemic stress rather than merely a reflection of monetary policy. This dynamic places immense pressure on corporations to deliver robust earnings, particularly those at the forefront of technological transformation, as the market’s appetite for growth is tempered by the sobering reality of unsustainable fiscal dynamics.
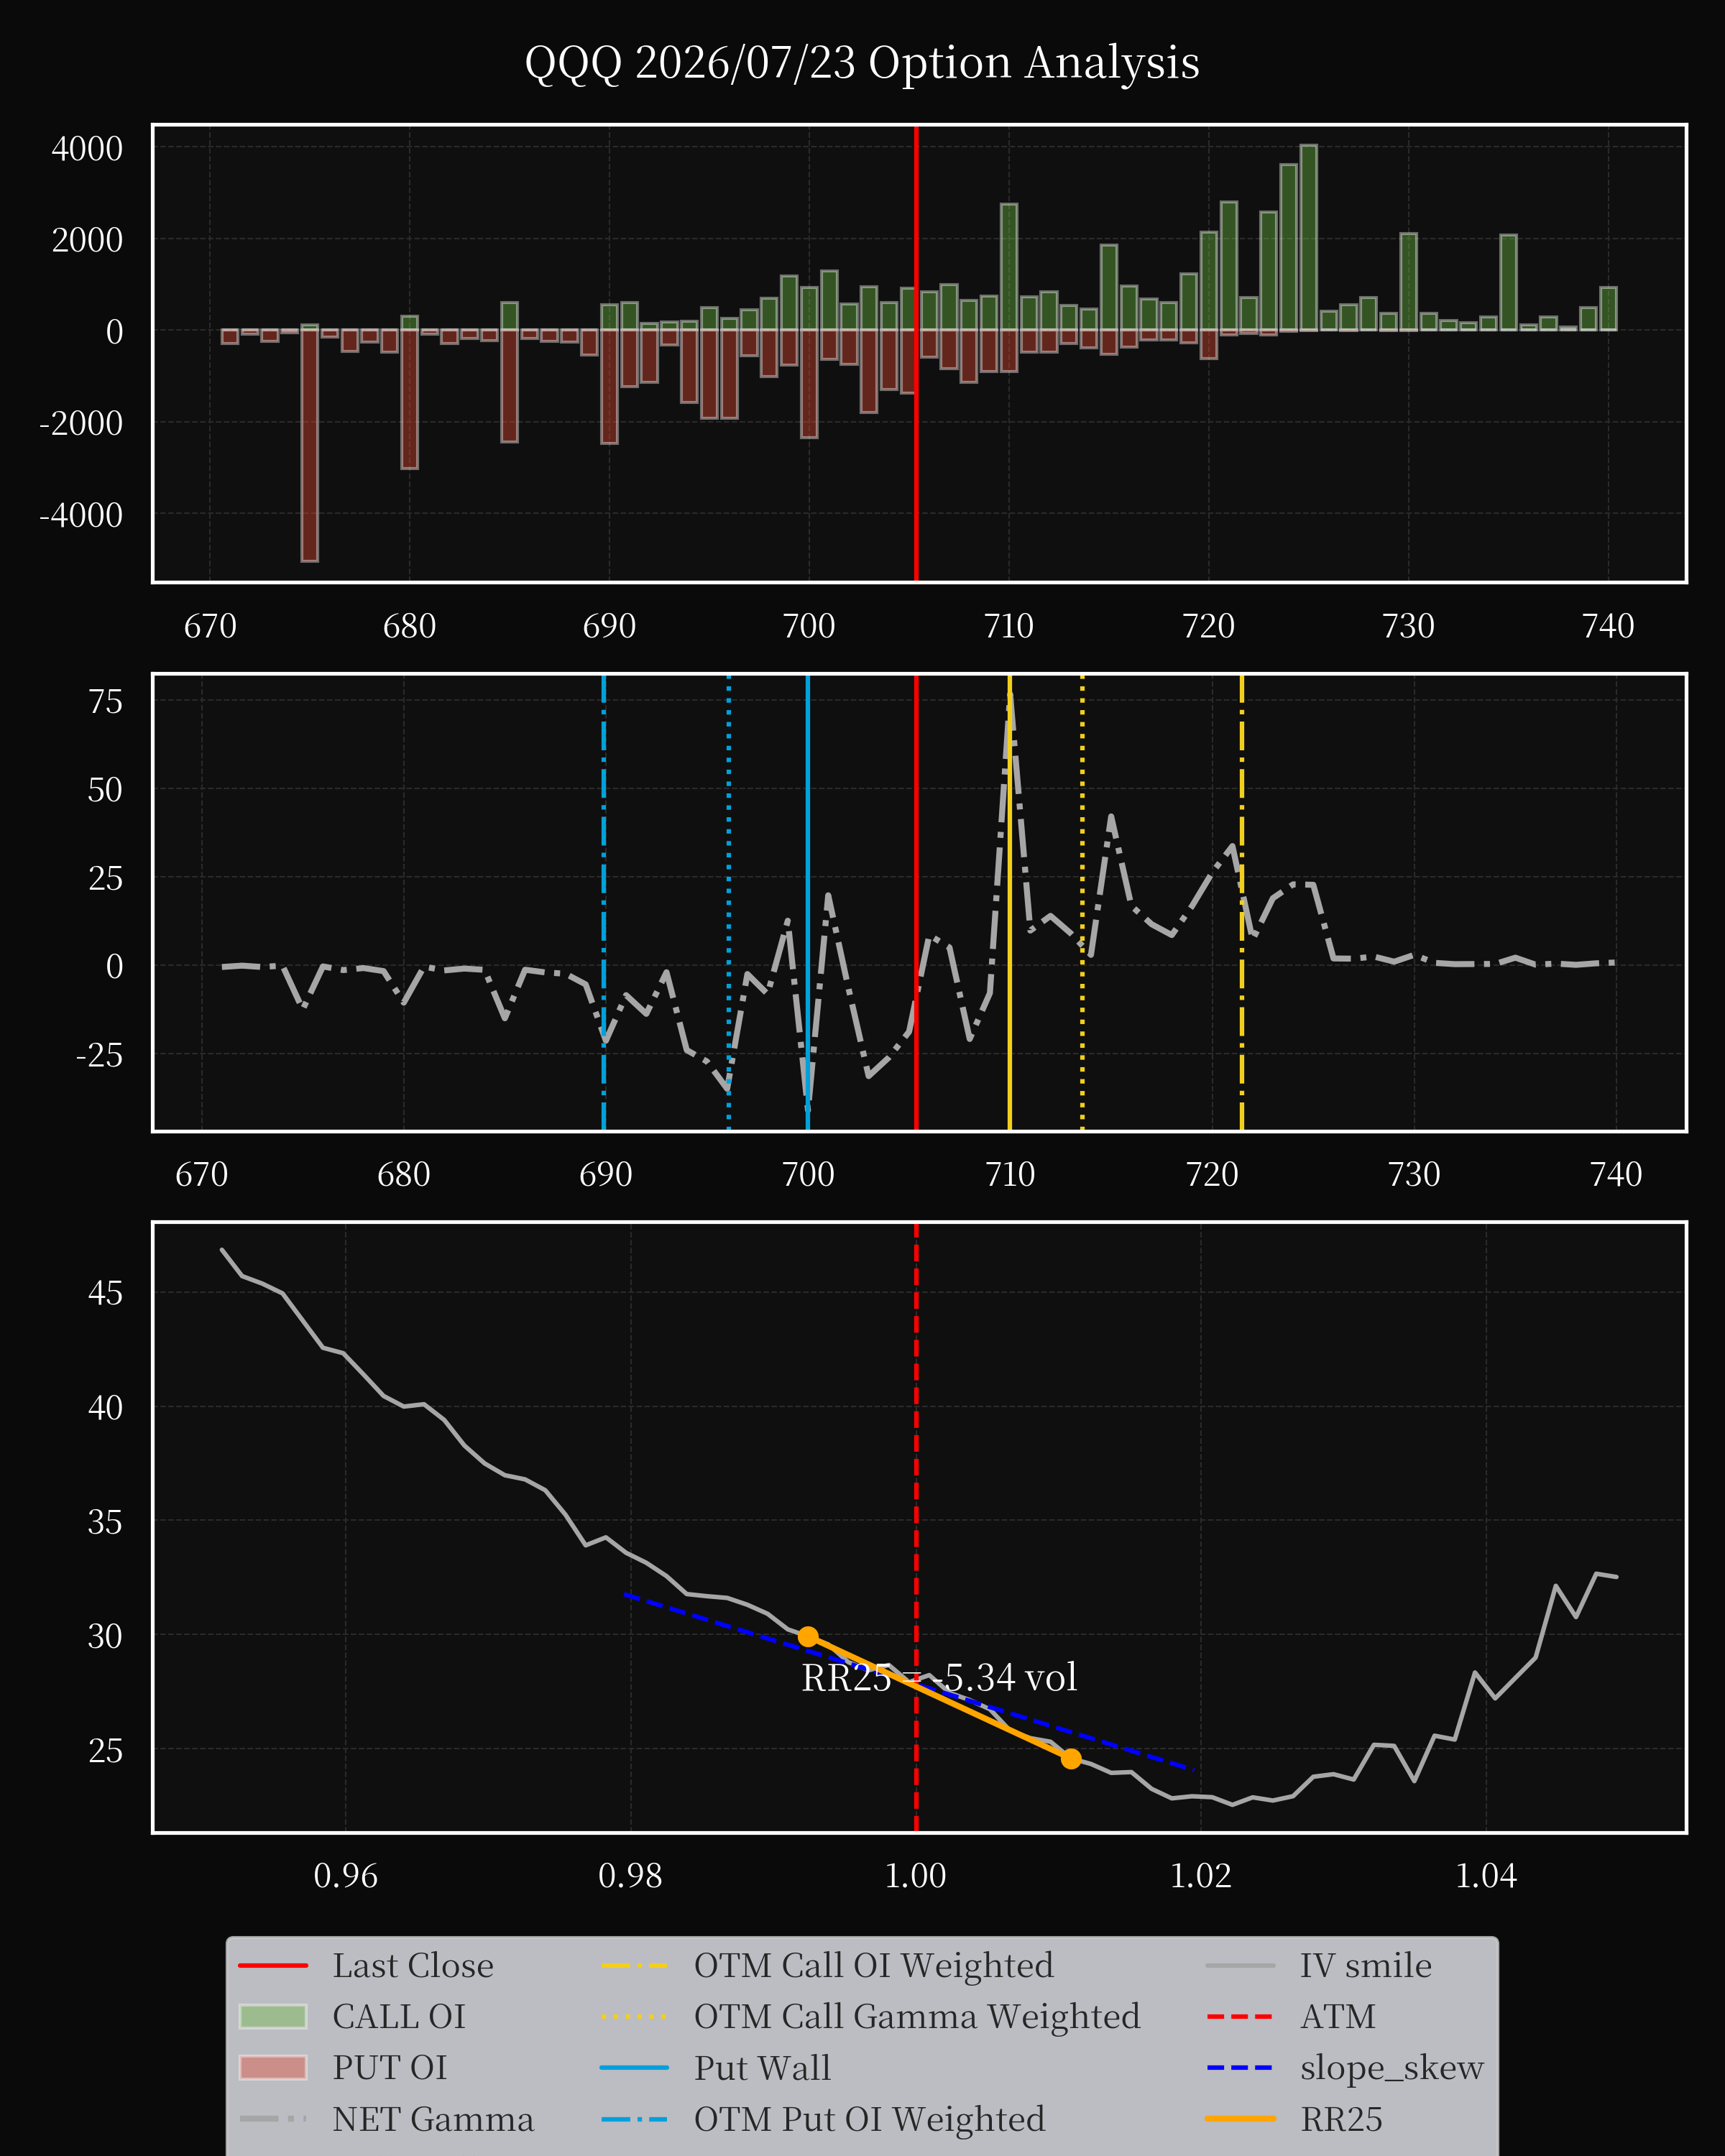
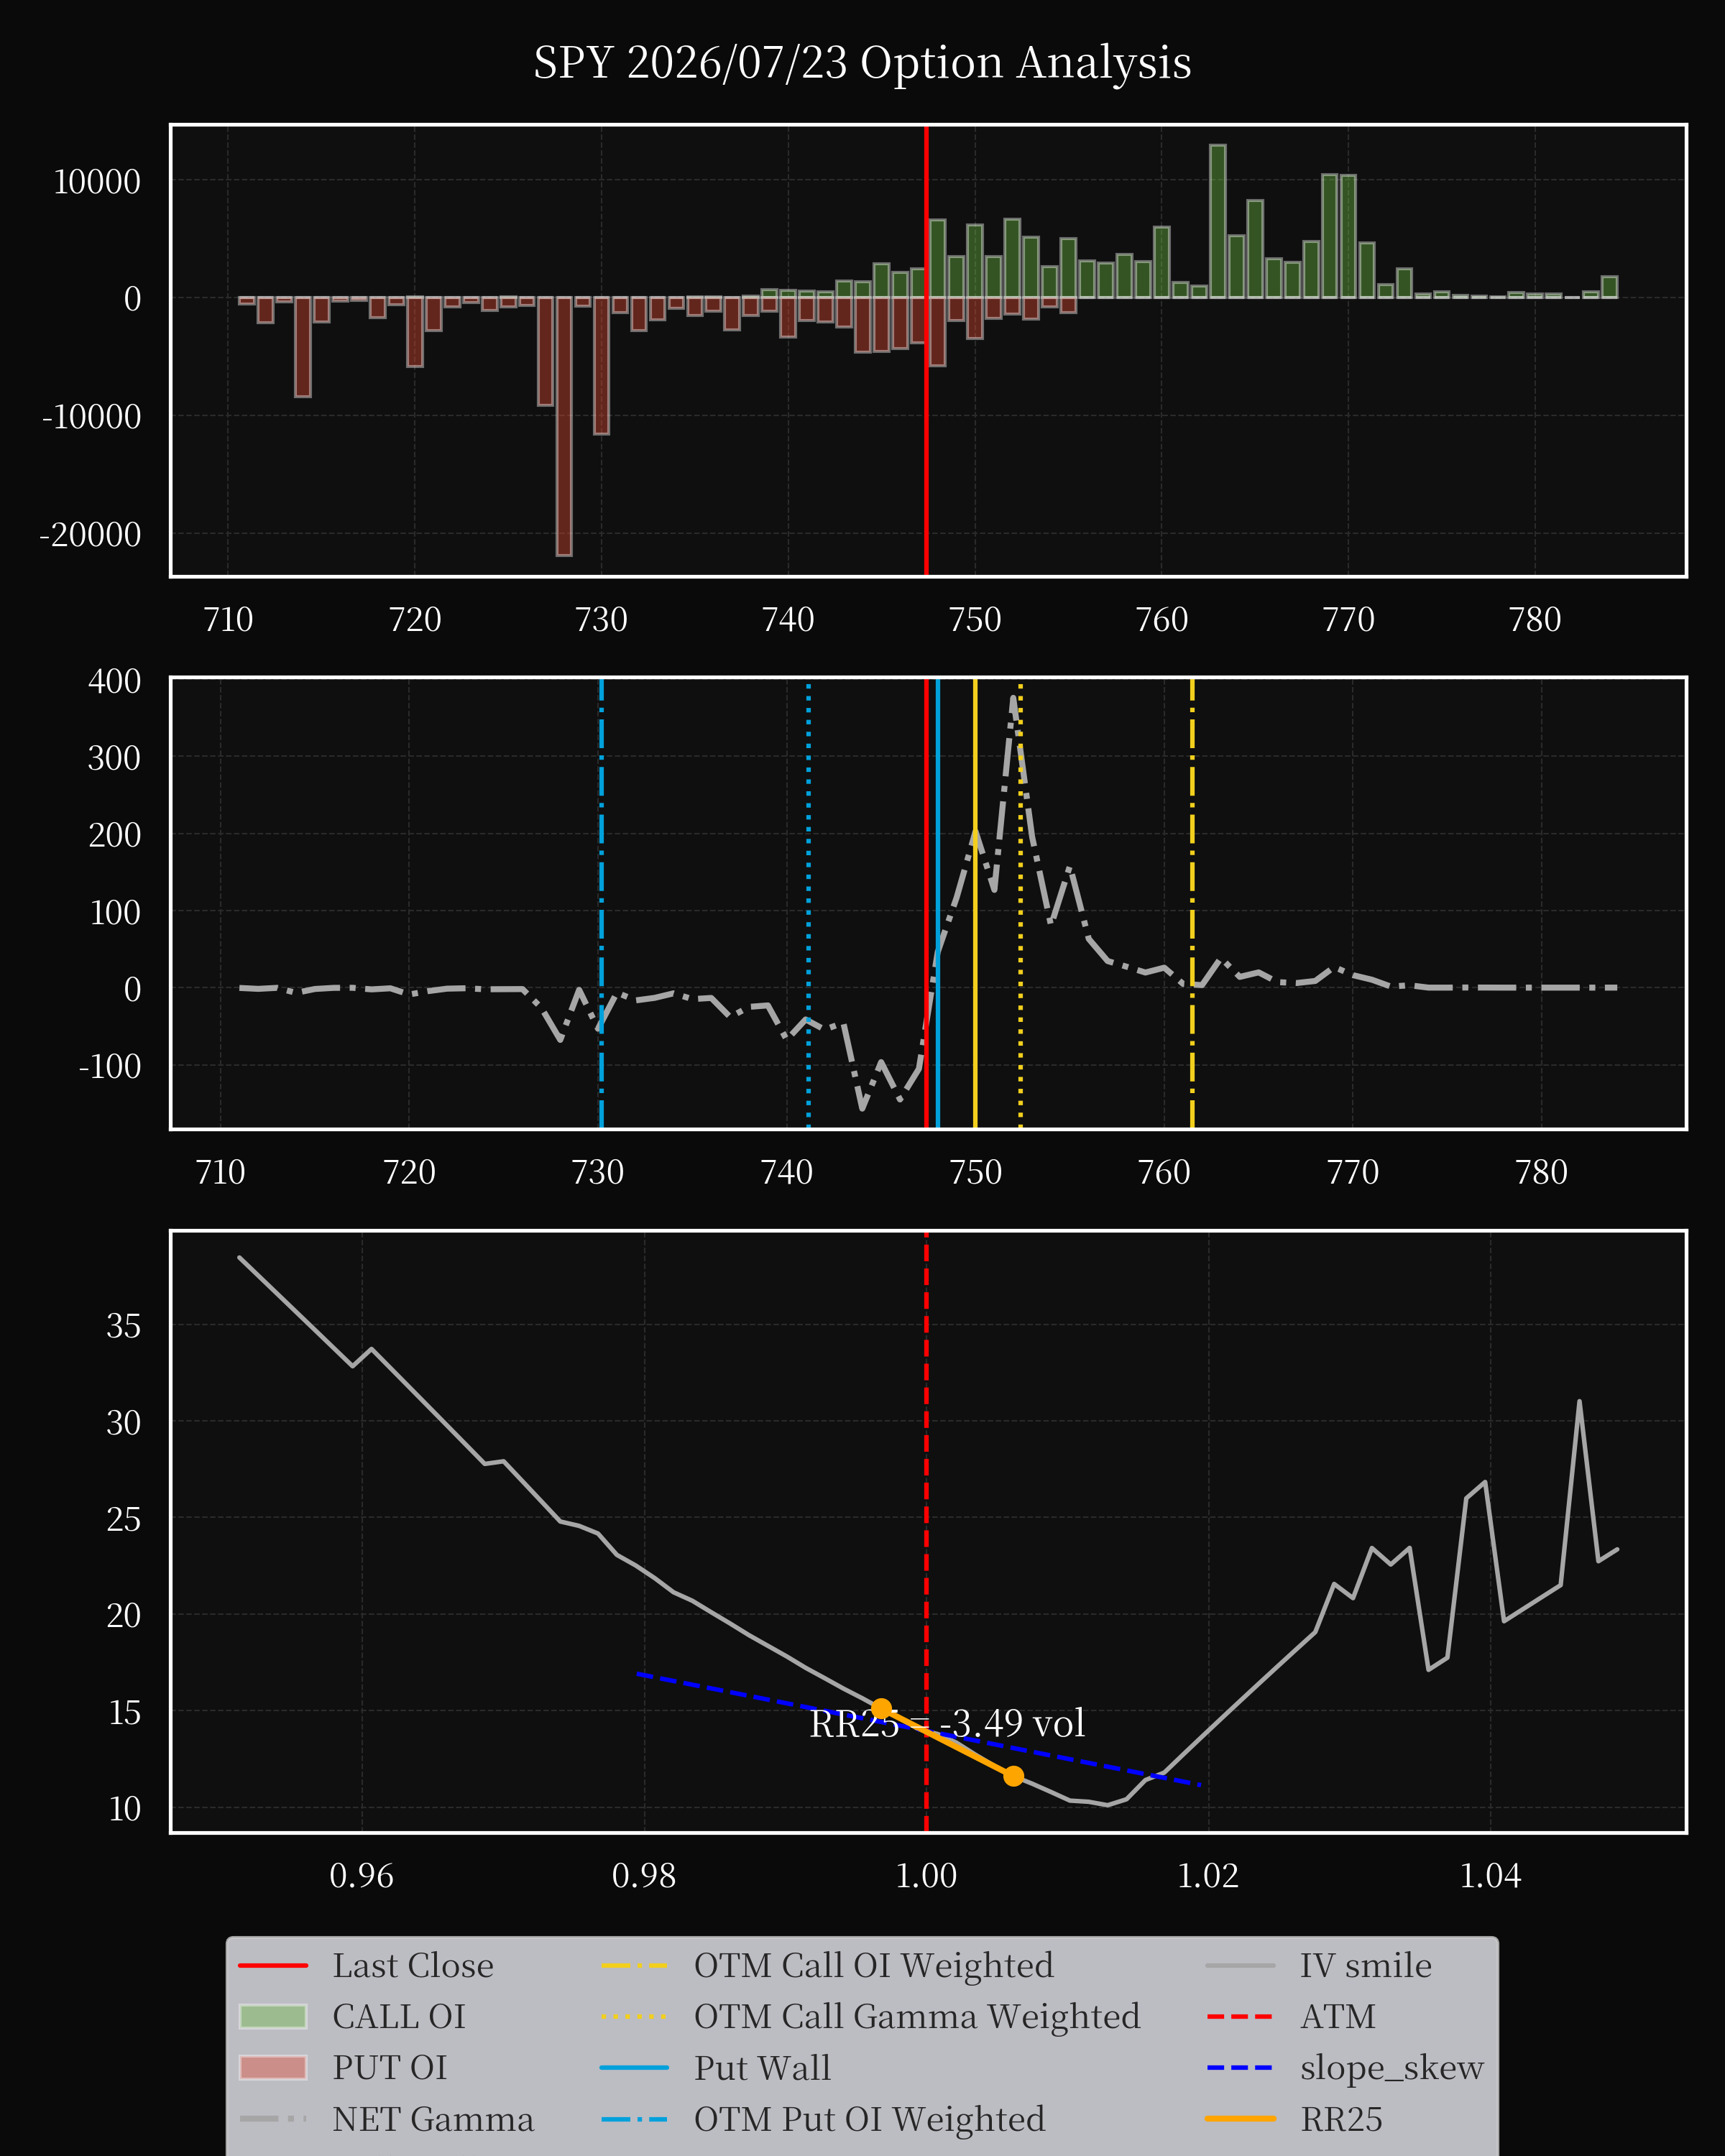
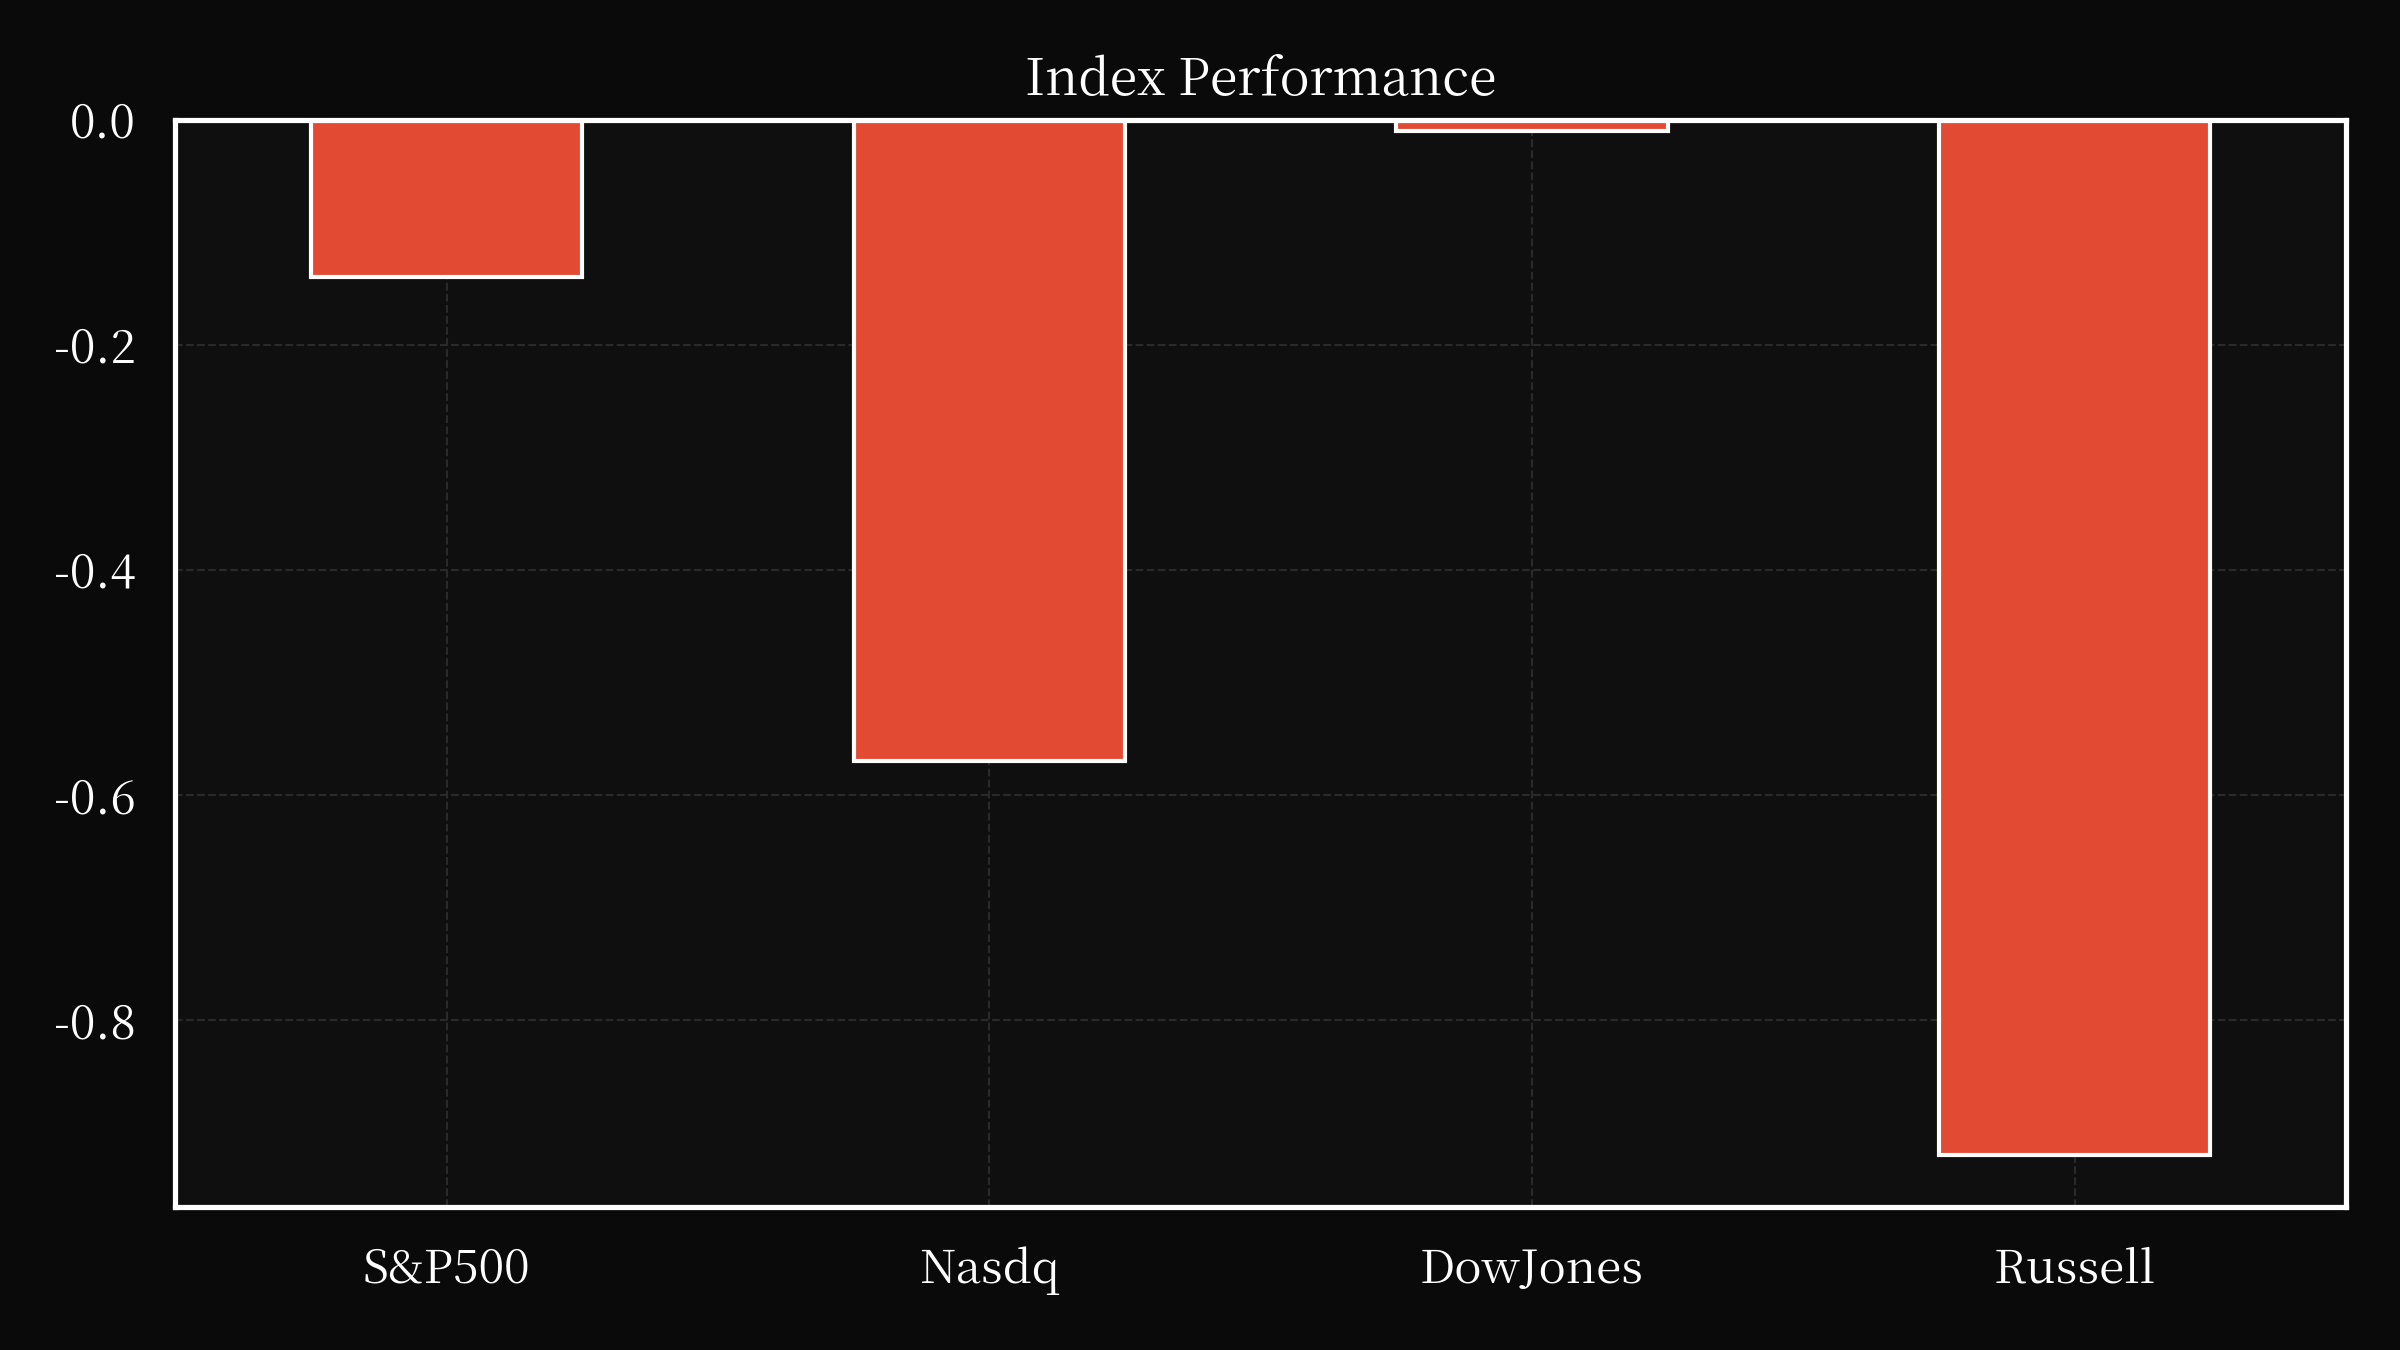
Equally pressing are the renewed threats to global energy supply chains, as escalating tensions in the Middle East—most notably, the prospect of strikes in the Strait of Hormuz—push crude oil prices to multi-month highs. The dual chokepoints of Hormuz and the Red Sea, through which a significant portion of global trade passes, have become focal points for geopolitical risk, with any disruption potentially sending shockwaves through energy markets and, by extension, the broader economy. The S&P 500’s modest decline and Nasdaq’s sensitivity to such developments underscore how even the threat of conflict can weigh on investor sentiment, particularly in sectors reliant on stable logistics and predictable input costs. While energy majors such as GE Vernova have managed to exceed guidance amid robust order books, the broader market remains vulnerable to exogenous shocks, with the specter of supply interruptions amplifying volatility across equities and commodities alike. The interplay between these external risks and internal earnings pressures creates a precarious backdrop for corporate performance, where operational resilience and strategic agility are tested not only by domestic policy but also by the unpredictability of international affairs.
Within this context, the earnings reports of Big Tech titans Alphabet and Tesla carry outsized significance, as markets scrutinize whether their massive investments in artificial intelligence and advanced manufacturing will translate into tangible financial returns. Alphabet’s quarterly results, released after a volatile week marked by Iran-related tensions and a surge in long-duration bond yields, will be pivotal in determining whether the company’s aggressive AI spending—intended to cement its competitive edge—can offset concerns over margin compression and slowing revenue growth. Similarly, Tesla’s performance will be measured not just by vehicle deliveries but by its ability to navigate regulatory scrutiny, labor challenges, and the broader skepticism surrounding its AI ambitions. Investors are acutely aware that while technological innovation drives long-term potential, near-term earnings are increasingly judged by the discipline with which companies manage costs, execute on strategic initiatives, and deliver shareholder value amid a backdrop of rising interest rates and fiscal uncertainty. The convergence of these factors—geopolitical volatility, fiscal anxiety, and corporate accountability—suggests that the coming weeks will be decisive in shaping both market direction and the broader narrative around growth, innovation, and resilience in the modern economy.
Watch List
CATY
Cathay General Bancorp reported a strong second-quarter 2026, with net income rising to $92.2 million, or $1.37 per diluted share, a 6.1% increase compared to $86.9 million in the first quarter. This growth was driven by expanded net interest margins and efficient execution across the company’s operations. President and CEO Chang M. Liu highlighted the strength of client relationships and the resilience of the business model. The bank’s efficiency ratio improved to 41.53% from 40.35% in the prior quarter. Key financial metrics showed a net interest margin of 3.48%, a yield on average interest-earning assets of 5.66%, and a cost of funds at 2.89%. Loan growth reached $446.7 million, primarily in commercial loans, while the allowance for loan losses increased to $218.9 million. Non-performing assets also rose, but the overall asset quality remained solid. Looking ahead, Cathay General Bancorp remains focused on prudent balance sheet management and supporting its clients’ financial needs.
NTST
NETSTREIT Corp. (NYSE: NTST) announced a solid second quarter, reporting net income of $0.06 and adjusted funds from operations (AFFO) of $0.35 per diluted share. The company completed strong gross investment activity totaling $298.9 million at a blended cash yield of 7.4%, and has increased its 2026 AFFO per share guidance to a new range of $1.37 to $1.39, alongside a rise in net investment guidance to $700 million to $800 million. Furthermore, the company announced a 2.3% increase to its quarterly dividend, now at $0.225 per share, and sold $184.4 million of forward equity sales during the quarter. Chief Executive Officer Mark Manheimer highlighted favorable marketplace conditions and a healthy, fully occupied portfolio. Reflecting the company’s strong balance sheet bolstered by equity sales, NETSTREIT is increasing its 2026 net investment guidance and AFFO per share guidance. The company also raised its 2026 guidance, including a revised expected cash G&A range of $16.5 million to $17.0 million. Notably, the company’s AFFO per share guidance now incorporates an estimated dilution of $0.05 to $0.08 per share (3.6 million to 5.9 million shares) due to outstanding forward equity. The company’s investment strategy focuses on high-quality, e-commerce resistant retail properties. NETSTREIT’s 2026 guidance is based on assumptions subject to change, and results may vary.
NTCL
Please provide me with the 6-K or 8-K content from the SEC Filing that you want me to summarize. I need the text of the filing to be able to fulfill your request. Once you paste the content here, I will summarize it into a fluent paragraph of no more than 300 words.
DBGI
Digital Brands Group, Inc. announced the approval and implementation of a reverse stock split of its common stock, effective July 24, 2026, at 12:01 a.m. Eastern Time. The 1-for-40 split was authorized to reduce the number of outstanding shares from 1,000,000,000 to 25,000,000, with the par value of each share remaining at $0.0001. This action was undertaken without requiring stockholder approval. Following the split, the company’s CUSIP number for the common stock is 25401N 606. Significant adjustments will be made to the company’s equity awards, warrants, and convertible preferred stock, resulting in a proportionate reduction in the number of shares and adjustments to exercise and conversion prices. The company issued a press release regarding the reverse stock split, which is filed as Exhibit 99.1 to this Form 8-K.
GL
Globe Life Inc. (GL) announced its second-quarter 2026 results, reporting net income of $3.65 per diluted common share, up from $3.05 in the year-ago period, and net operating income of $3.61 per diluted common share, also an increase from $3.27. Consequently, the company has raised its full-year 2026 earnings guidance to a range of $15.55 to $15.95, reflecting a $0.10 midpoint increase. Management attributes this improved outlook to strong financial performance. Notably, net operating income, a non-GAAP measure, provides a clearer picture of the company’s operational profitability by excluding non-operating items. The company’s insurance underwriting margin is primarily driven by life insurance at 78% and health insurance at 66% of total premium revenue. Premium revenue is split between these segments, with health insurance contributing 34%. Several key metrics were highlighted, including a 7.0% administrative expense ratio, a 4% increase in net investment income, and a 2% increase in average invested assets. The company’s repurchase of 1.1 million shares of its common stock at $154.28 represents a $175 million investment. Looking ahead, Globe Life acknowledges several potential risks, including economic conditions, regulatory changes, competitive pressures, and cybersecurity threats. The company’s liquidity remains robust, supporting its operations and future growth. Financial information and access to the webcast are available on the Globe Life website.
DOMO
Domo, Inc. announced the execution of a definitive asset purchase agreement with Progress Software Corporation to sell substantially all of its AI and Data Platform Business, encompassing its software platforms and related technologies, for approximately $400 million. This transaction is subject to customary conditions and includes a termination fee payable if certain conditions aren’t met. Simultaneously, Domo adopted a tax benefits preservation plan to protect against limitations on its net operating loss (NOL) carryforwards and other tax attributes, aiming to reduce future U.S. federal income tax obligations. The plan also addresses potential “ownership changes” by deterring acquisitions that could impact the utilization of these valuable assets. The deal is supported by a voting and support agreement with key stockholders, and Domo will retain its NOLs. The agreement includes a no-shop provision restricting Domo from soliciting competing bids for a specified period. Furthermore, Domo has implemented a tax benefits preservation plan to protect against potential limitations on its NOLs and other tax attributes, safeguarding these assets from impairment.
EFSC
Enterprise Financial Services Corp. reported a net income of $40.9 million, a decrease of $8.4 million compared to the prior quarter, translating to earnings per share of $1.09. Key financial highlights include a tangible common equity/tangible assets ratio of 9.04%, a tangible book value per common share of $42.30, and a CET1 ratio of 11.5%. The company issued $175.0 million in 6.25% fixed-to-floating rate subordinated notes due in 2036 and increased its quarterly common stock dividend by $0.01 to $0.34 per share, alongside a preferred stock dividend of $12.50 per share. Through common stock repurchases, the company returned $22.9 million to stockholders. Net interest income rose by $2.6 million to $168.7 million, with a net interest margin of 4.30%. However, PPNR (Proportion of Pretax Income) decreased by $2.2 million to $68.2 million, and ROAA (Return on Average Assets) and PPNR ROAA both declined to 0.95% and 1.58%, respectively, reflecting a lower return on assets. The loan portfolio increased by $199.6 million to $11.9 billion, with a loan-to-deposit ratio of 82.0%. Deposits decreased by $21.8 million to $14.5 billion, with a noninterest-bearing deposit ratio of 34%. Looking ahead, the company’s priorities include improving asset quality, leveraging technology, and fostering organic loan and deposit growth. Specifically, they aim to reduce criticized loans, enhance credit underwriting, and expand technology usage. The company also emphasized disciplined pricing and relationship-based growth strategies to drive loan and deposit expansion.
FULT
Fulton Financial Corporation reported strong financial performance in the second quarter of 2026, demonstrating disciplined management and strategic initiatives. Net income available to common shareholders reached $115.9 million, a significant increase from $92.2 million in the prior quarter, driven by improved ROAA and ROATCE. The company’s efficiency ratio continued to decline to 57.3%, reflecting ongoing efforts to manage non-interest expense. Net interest income increased by 2 basis points to 3.60%, supported by a loan yield of 5.80% and a cost of deposits of 1.81%. Key highlights included a robust balance sheet with strong liquidity, the realization of benefits from strategic initiatives, and a continued commitment to organizational efficiency. Operating PPNR reached $152.9 million, showcasing the company’s profitability. The Blue Foundry Bancorp Transaction contributed approximately $10.5 million to operating non-interest expense, and is expected to continue to drive efficiencies. Average Deposits and Borrowings & Other, Cost of Deposits and Cost of Funds NII(1) NII on a non-FTE basis using a 21% federal tax rate and statutory interest expense disallowances. (m ill io ns ) (b ill io ns ) (b ill io ns ). Salaries and employee benefits $120,184 $109,917 $121,632 $111,265 $107,123 $10,267 Data processing and software 20,419 18,662 19,695 18,535 18,262 1,757 Net occupancy 17,841 18,229 17,554 15,954 16,410 (388) Other outside services 14,999 12,750 13,105 12,951 12,009 2,249 Intangible amortization 5,910 5,349 5,365 5,368 5,460 561 FDIC insurance 4,430 4,249 4
RGP
Resources Connection, Inc. (RGP) announced its financial results for the fourth quarter and full fiscal year ended May 30, 2026, revealing a challenging period marked by revenue declines and increased losses. Fourth quarter revenue fell to $106.1 million, down from $139.3 million a year prior, with a corresponding gross margin decrease to 37.6% from 40.2%. Adjusted SG&A expenses improved to $40.5 million, driven by restructuring efforts and cost-cutting initiatives. Full-year revenue decreased to $452.0 million compared to $551.3 million, and net loss improved to $40.6 million, reflecting significant non-run-rate items including restructuring and separation costs related to the sale of its crisis communication business, Sitrick, LLC. Despite these challenges, CEO Roger Carlile highlighted strategic priorities focused on refocusing the On-Demand Talent segment, scaling the Consulting segment, exploring AI opportunities, streamlining operations, and aligning costs. The company experienced softer demand in traditional operational accounting skills and longer sales cycles for consulting projects. Billable hours decreased significantly, and the average bill rate declined due to revenue mix shifts. Looking ahead, RGP is continuing to invest in its strategic initiatives, anticipating a ramp-up period for these investments. The company terminated its existing credit facility and entered into a new one with improved terms. While Adjusted EBITDA improved to $5.0 million compared to $9.8 million in the prior year, reflecting a margin of 1.1% versus 7.1%, the company remains focused on achieving a more efficient cost structure and driving revenue growth through its strategic priorities.
HLMN
Hillman Solutions Corp. has successfully completed a significant refinancing of its debt obligations, securing $735 million in senior secured term loans and $375 million in asset-based revolving credit agreements. The new financing, facilitated by Jefferies Finance LLC and U.S. Bank National Association, replaces existing agreements dating back to 2021 and 2018, respectively. Proceeds from the term loans will fully refinance outstanding obligations and terminate previous credit arrangements, while the ABL credit agreement will support the company’s working capital needs and general corporate purposes. Both agreements feature customary representations, warranties, and covenants, with pricing structured around SOFR/ABR margins and varying maturities up to 2033 and 2031, respectively. Holdings, the parent company, guarantees these facilities, alongside the borrower and its subsidiaries, ensuring a robust financial foundation for Hillman Solutions Corp.
IanFV (www.ianfv.com) is the world's first pure-blood, neutral research institution built on LLM (Large Language Models) specifically for individual investors. Founded by a top-tier team with backgrounds from Tsinghua, Harvard, Morgan Stanley, and UBS, we are committed to breaking down high-priced information barriers and providing institutional-grade investment research at affordable prices. Unlike traditional institutions, IanFV does not serve big-money sponsors or inflate market bubbles. Leveraging a proprietary knowledge graph and a fully localized deployment architecture, we achieve a differentiated competitive advantage through light assets and high efficiency. Our research reports refuse to "sell dreams": valuation reports are based on point-in-time intervals rather than reverse-engineered numbers; industry reports focus relentlessly on real trends over the next six to twelve months; and in-depth reports penetrate market bubbles to strike at the core of corporate survival moats—all to ensure investors hold the most authentic research cards in the secondary market.