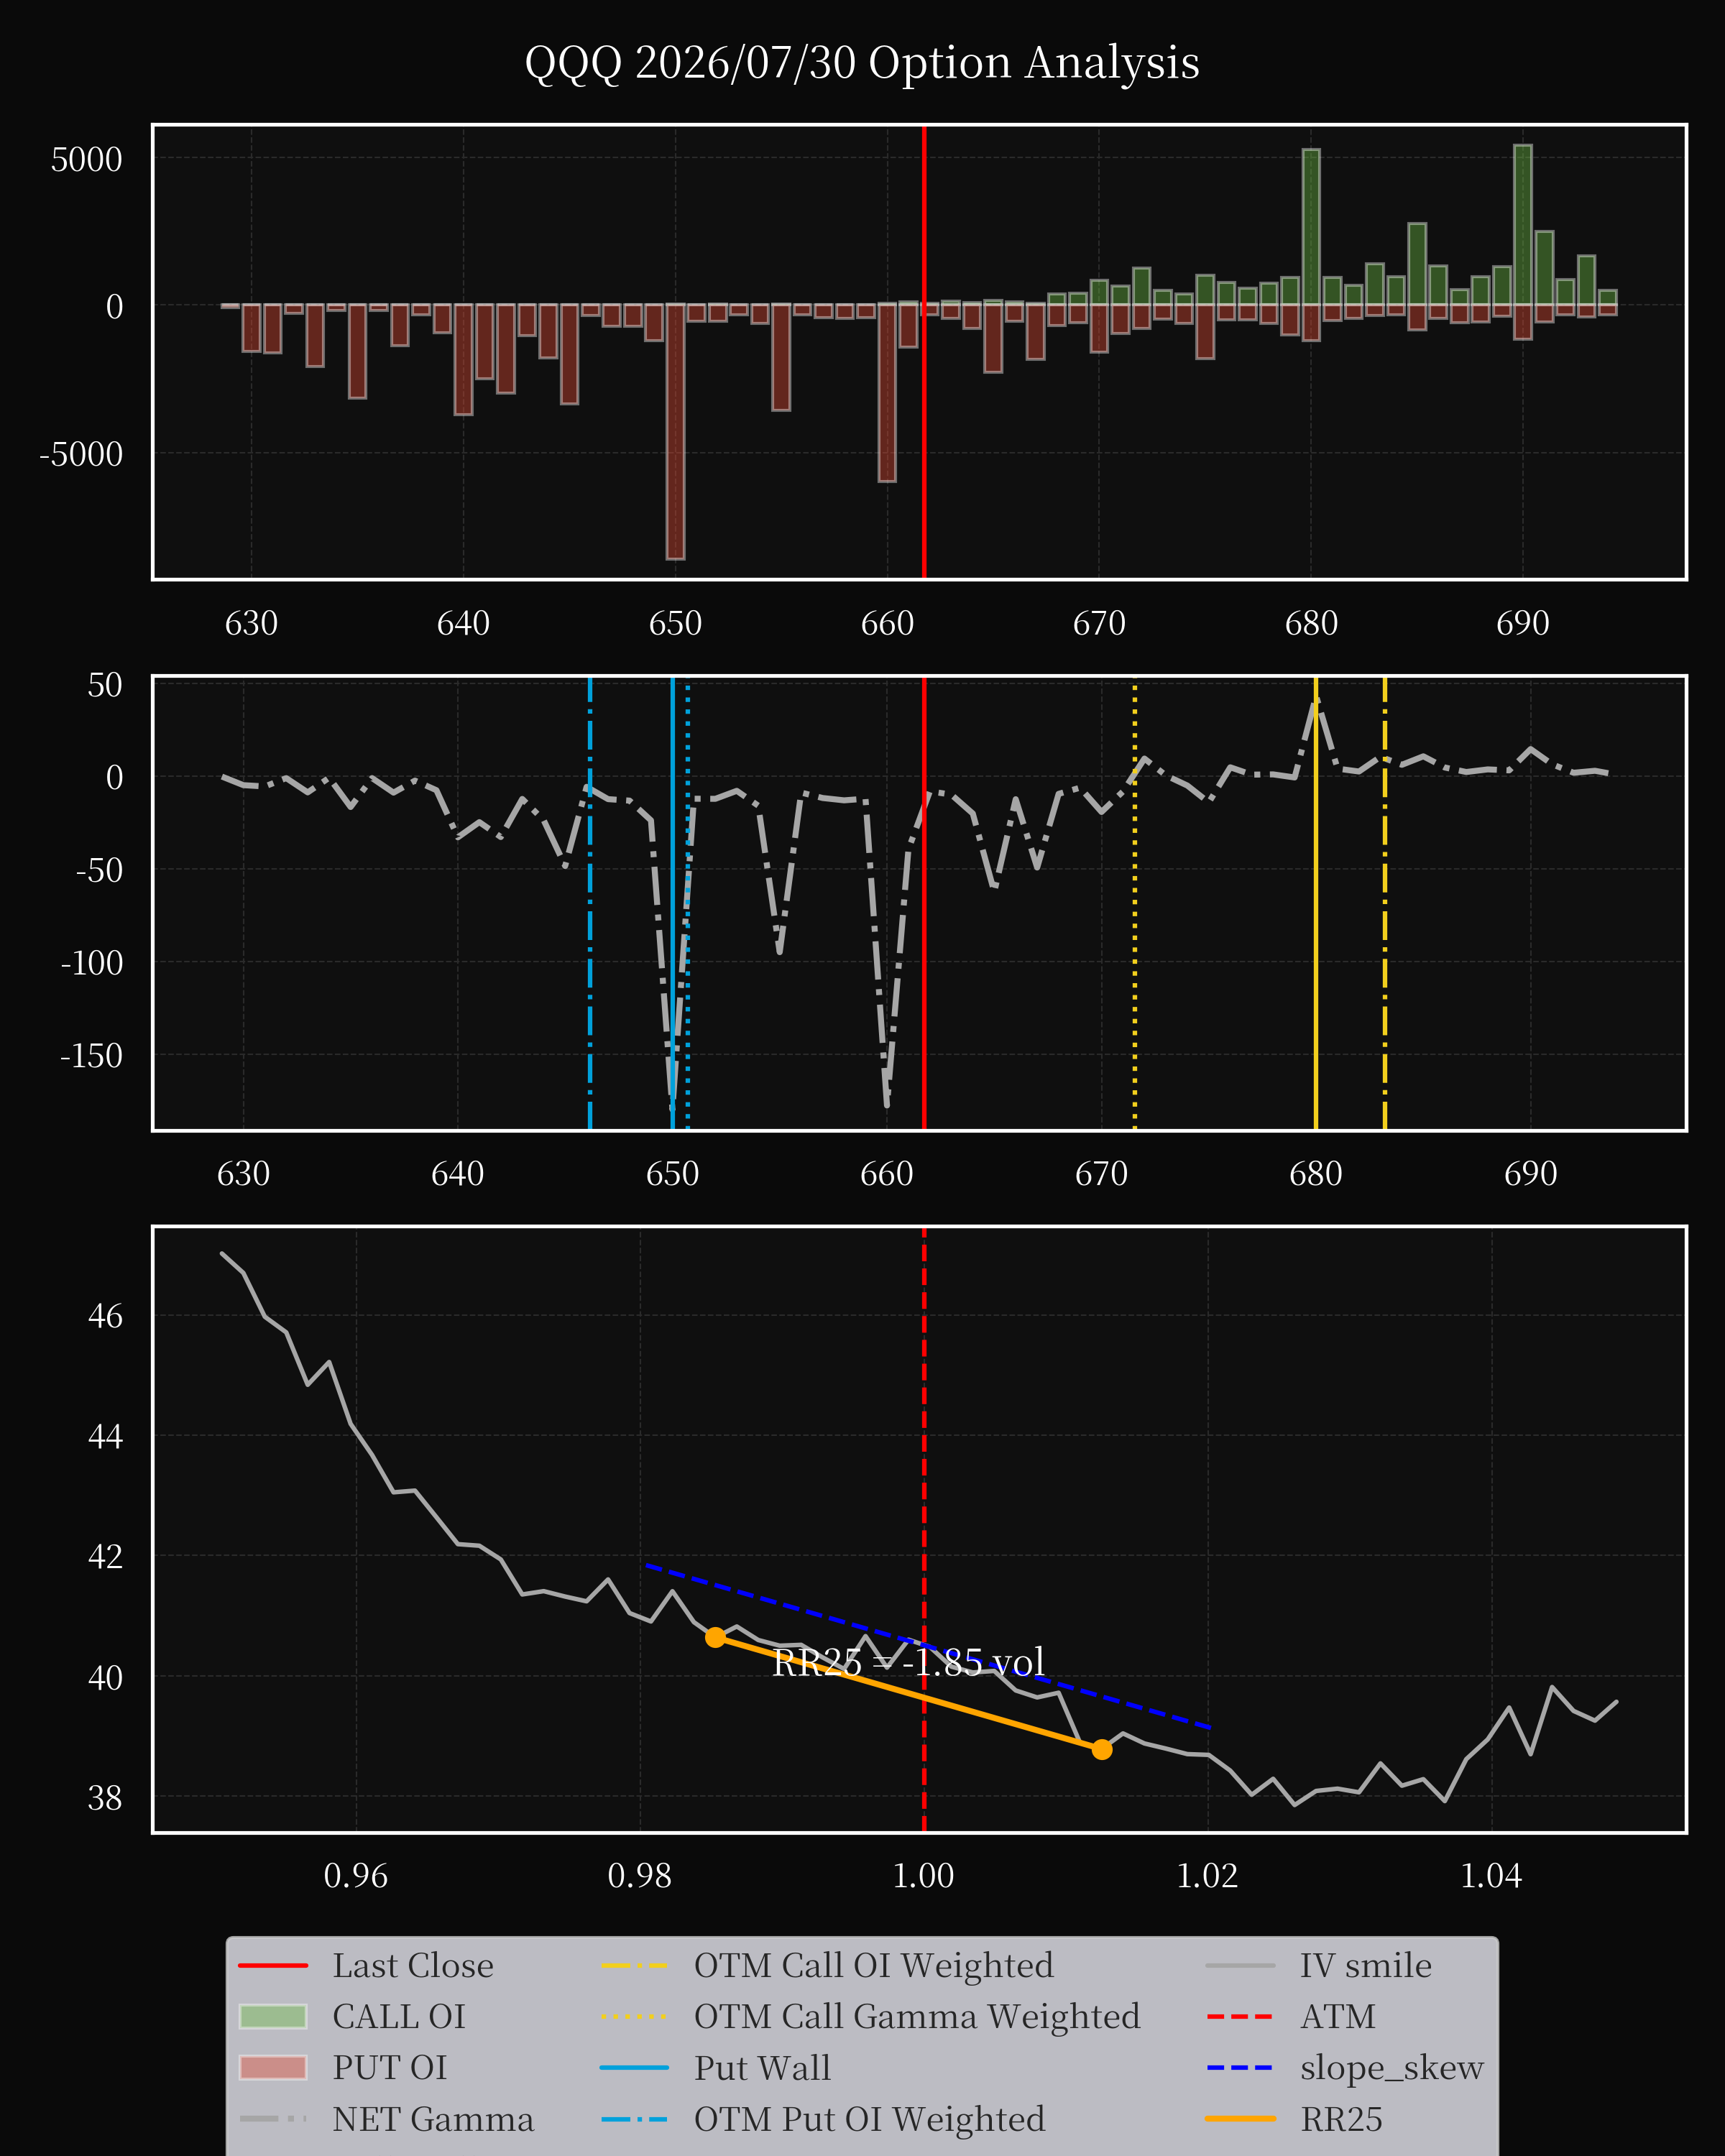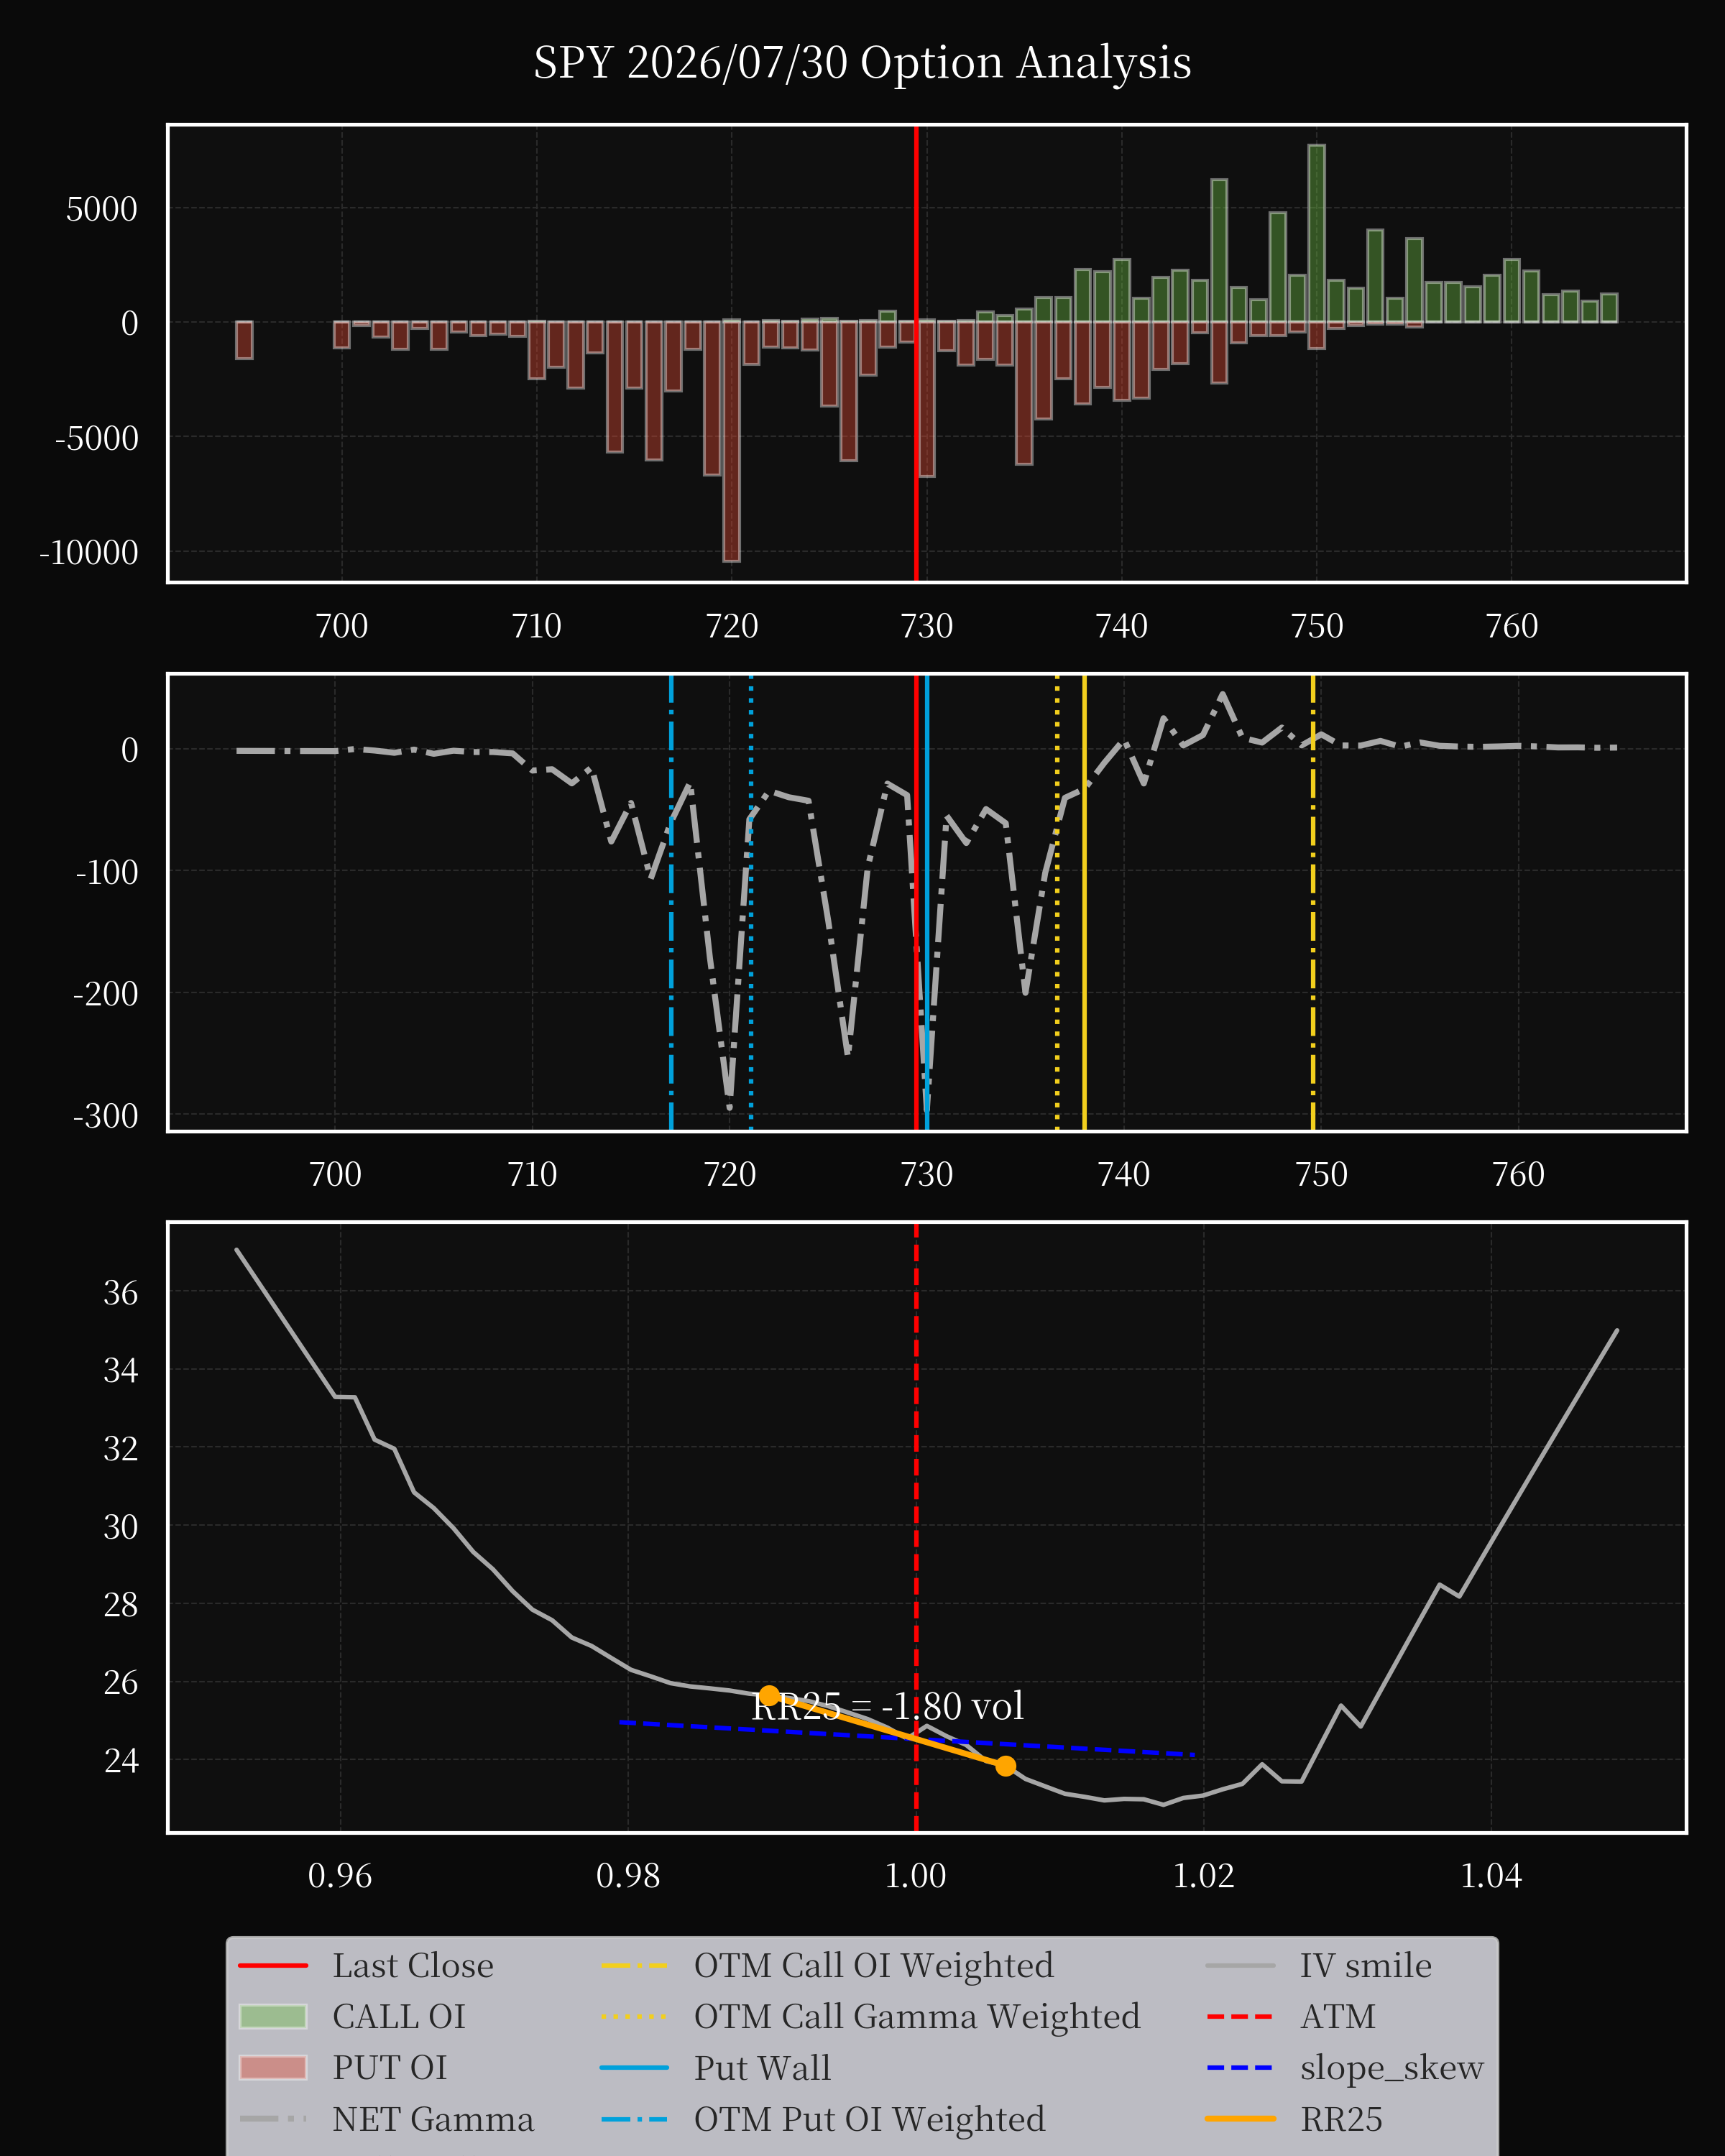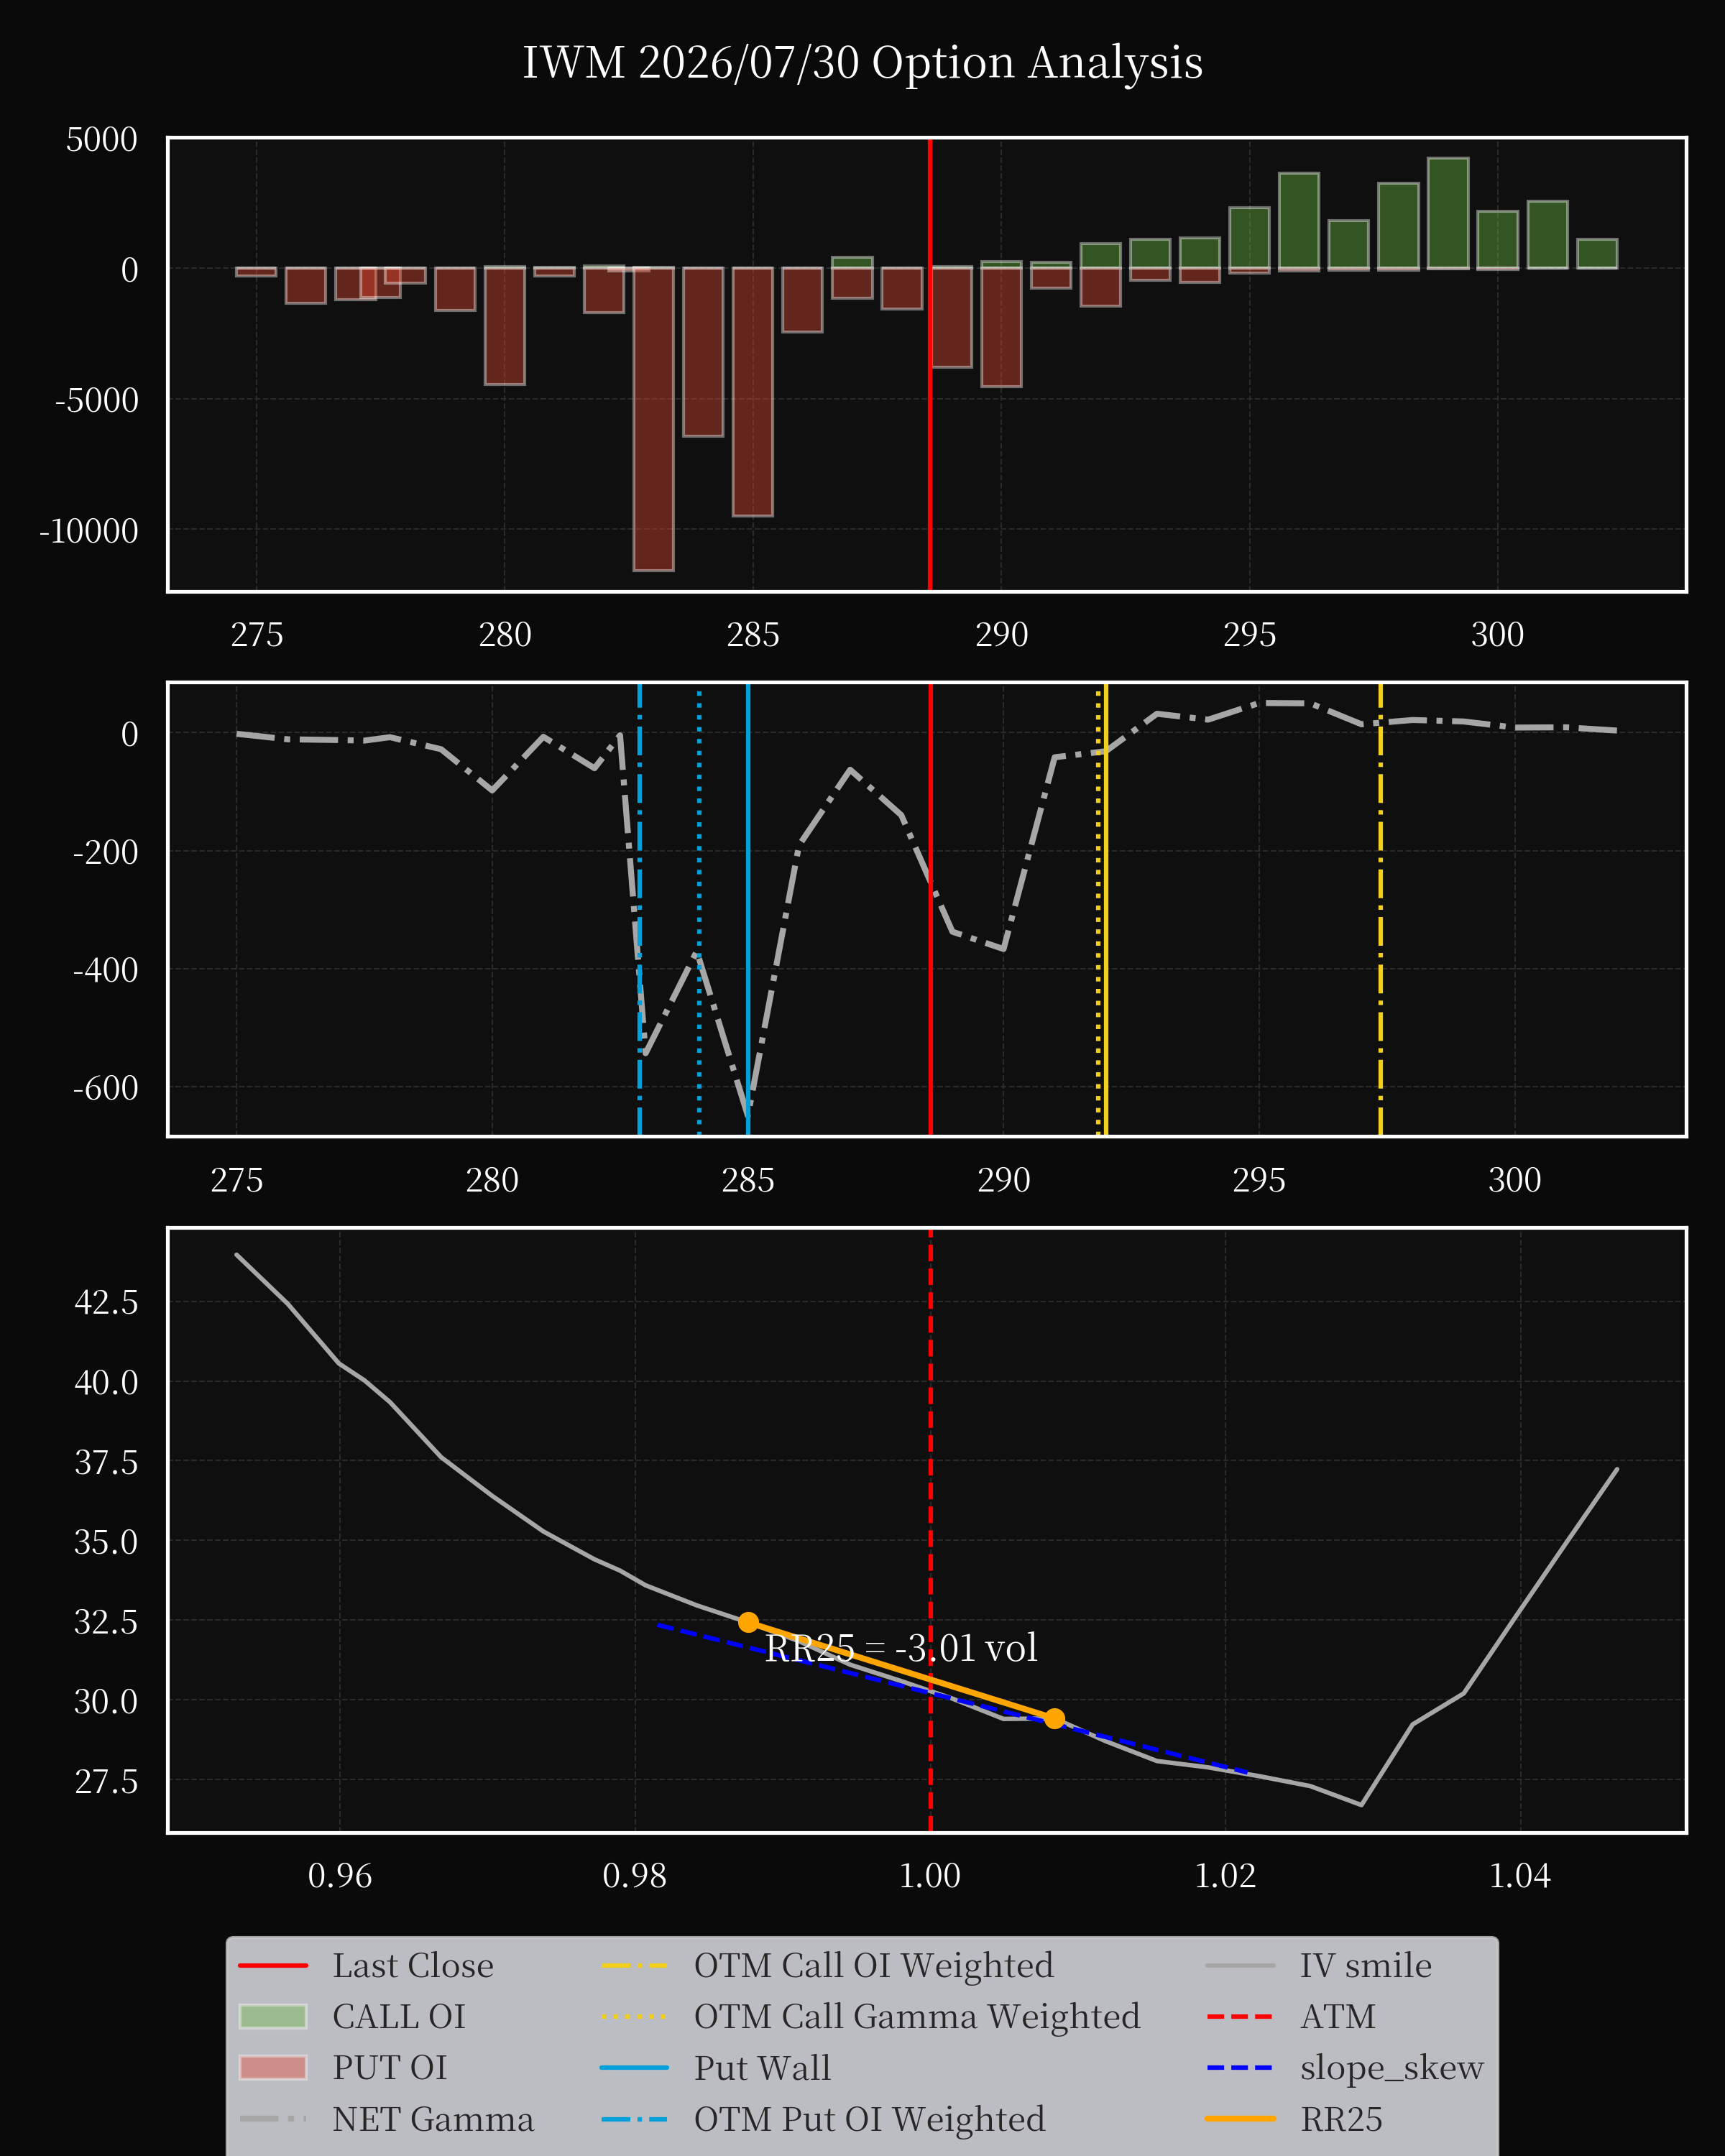
Overall
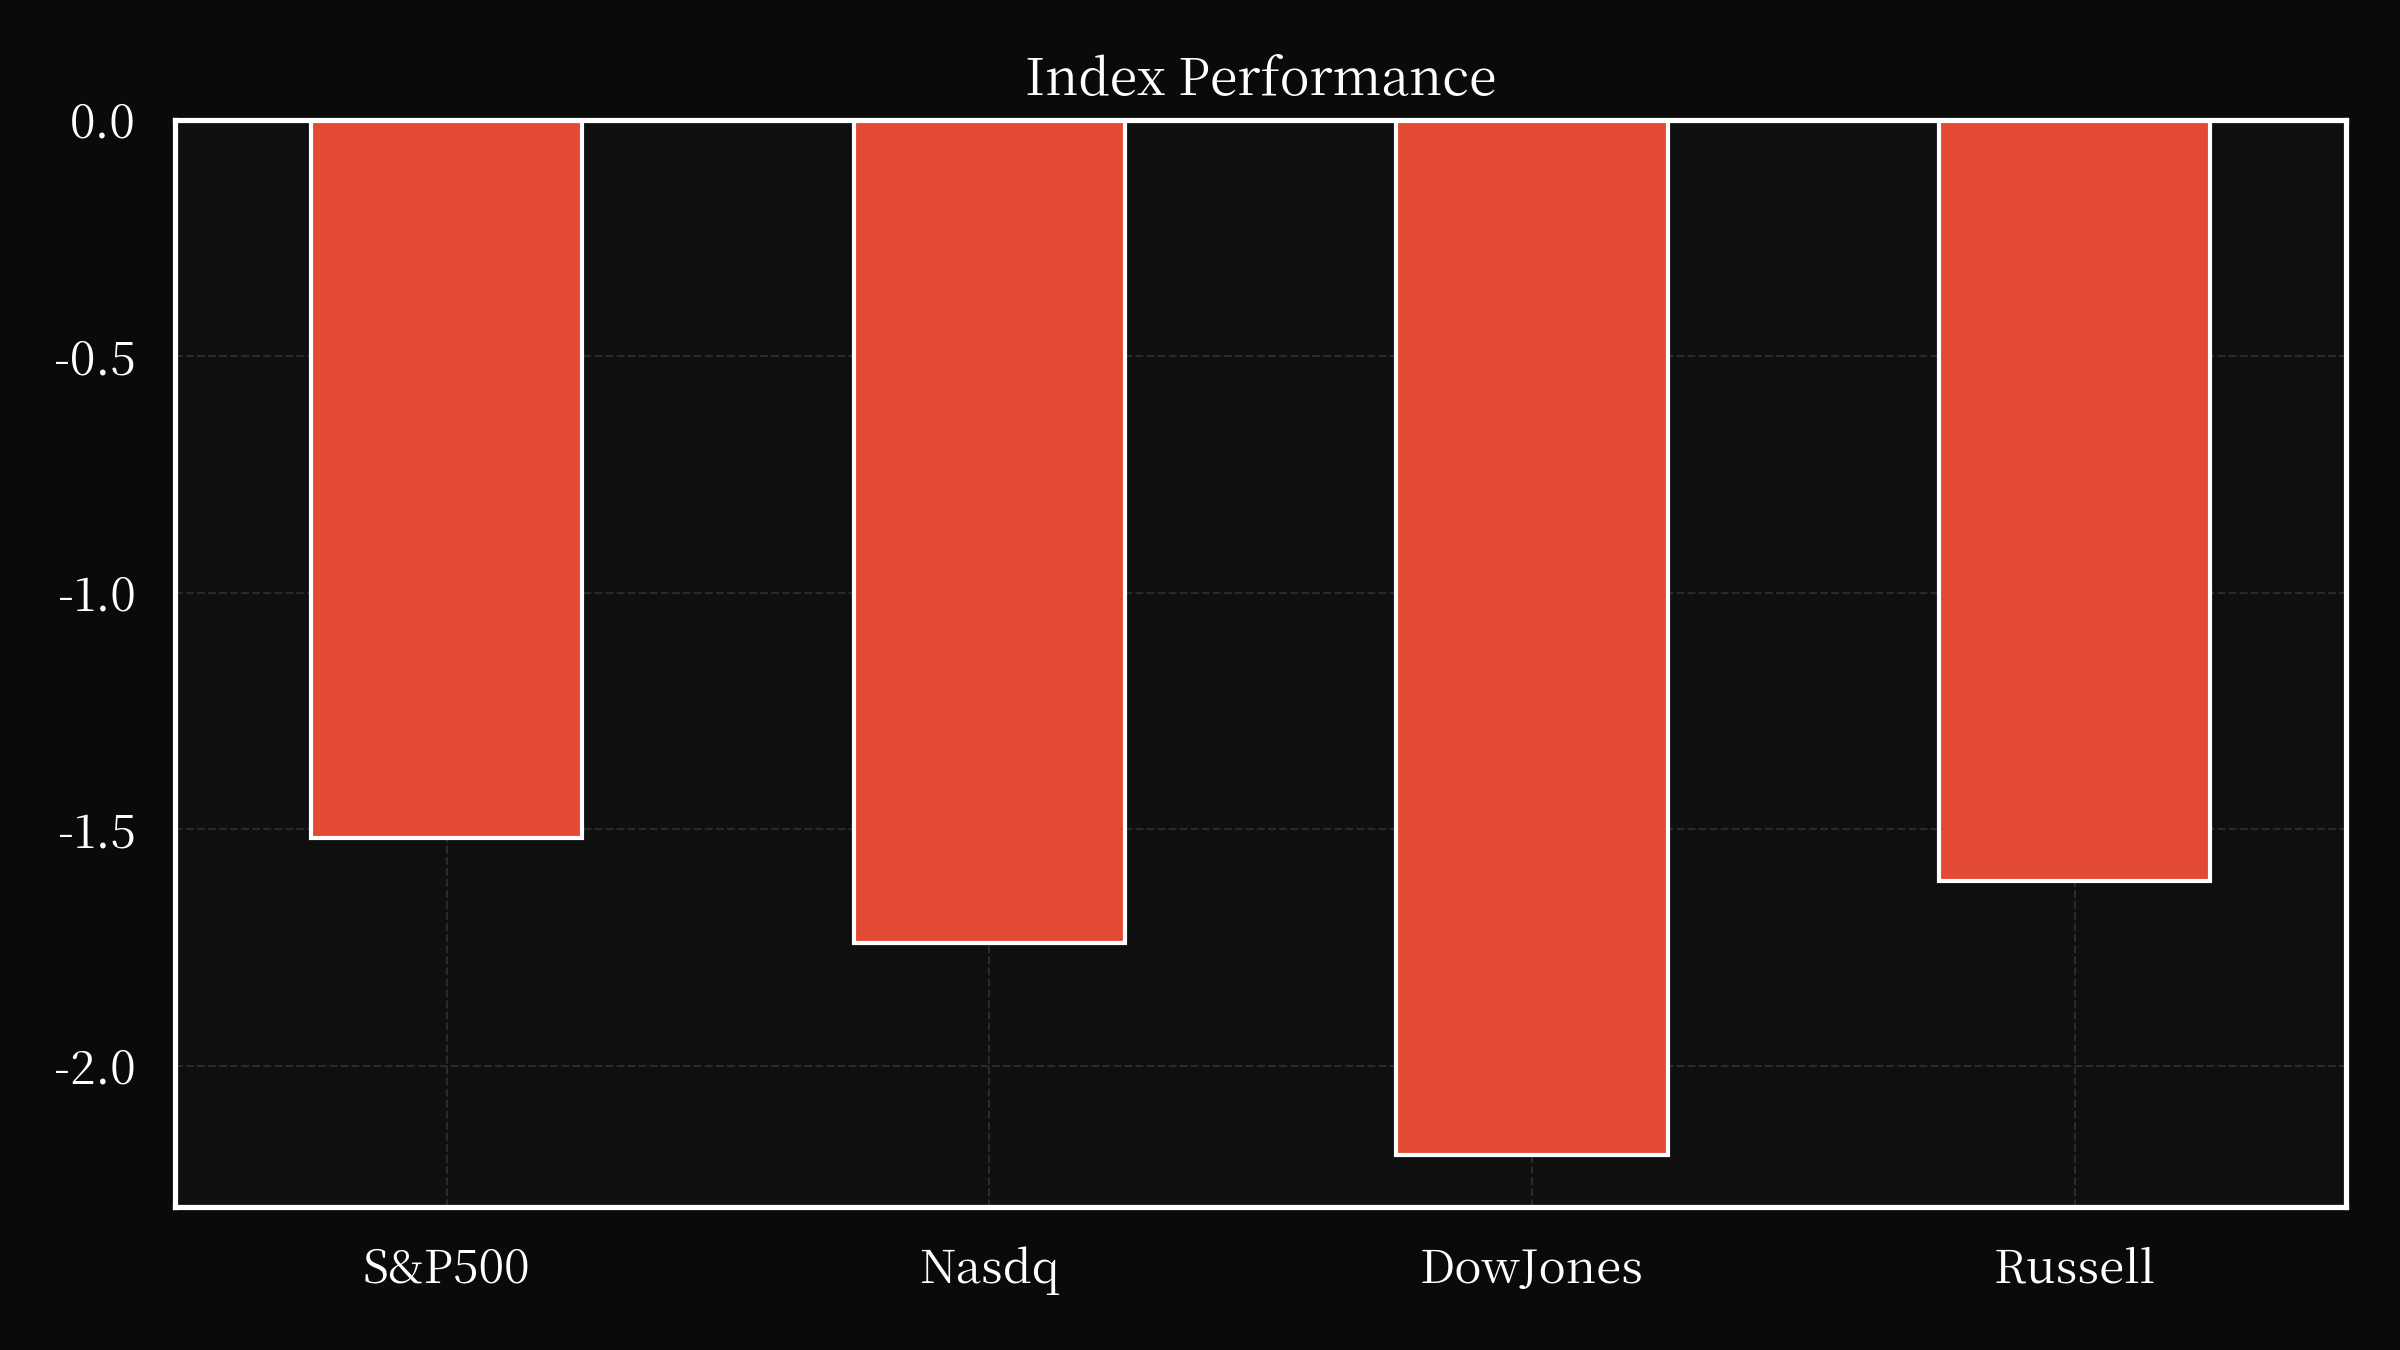
The market’s trajectory today reflects a complex interplay of monetary policy signals, geopolitical tensions, and sector-specific dynamics, with the Federal Reserve’s decision to hold rates steady amid divergent views among its leadership serving as the central pivot around which investor sentiment has revolved. The Fed’s refusal to raise rates, despite three bank presidents advocating for a hike, underscores the institutional caution in balancing inflationary pressures against economic growth concerns, particularly as inflation remains elevated above the 2% target despite recent stabilization efforts. This stance has precipitated a broad-based sell-off in equities, with the Dow Jones Industrial Average declining 2.2% and the S&P 500 and Nasdaq Composite each falling over 1.5%, signaling a repricing of risk assets in response to the Fed’s dovish signal.
The absence of a rate hike has amplified uncertainty regarding the trajectory of monetary policy, as the Fed’s communication has grown increasingly opaque, leaving market participants to grapple with ambiguous forward guidance. This ambiguity has been compounded by the recent escalation in geopolitical tensions between the U.S. and Iran, which has disrupted oil markets and introduced volatility into energy pricing. The surge in West Texas Intermediate crude futures to $90.74 per barrel, driven by renewed hostilities and the potential for further escalation, has reverberated across industrial and transportation sectors, exacerbating inflationary pressures and complicating corporate cost management. The interplay between energy prices and monetary policy has created a dual challenge for businesses, as rising input costs threaten profit margins while the Fed’s reluctance to tighten policy further emboldens inflationary expectations.
Sectoral performance has been starkly differentiated, with technology stocks experiencing a pronounced correction amid mixed signals about the economic impact of artificial intelligence. While companies like Microsoft have reported robust earnings and accelerated growth in cloud computing, others such as Meta Platforms have faced scrutiny over their AI investment strategies and revenue forecasts, leading to sharp declines in share prices. The Nasdaq’s 1.8% drop, driven by weakness in semiconductor and semiconductor-adjacent industries, highlights the fragility of growth-oriented equities in an environment of heightened uncertainty. Conversely, firms with exposure to capital-intensive infrastructure, often categorized under the HALO (Heavy Assets, Low Obsolescence) framework, have outperformed, as investors seek stability amid macroeconomic volatility. This divergence underscores the market’s recalibration toward assets perceived as resilient to both inflation and geopolitical shocks.
The equity market’s reaction to the Fed’s inaction has also been shaped by broader macroeconomic indicators, including bond yields and currency movements. The 10-year Treasury yield’s rise to 4.621%, coupled with the dollar’s relative strength, has pressured risk assets, particularly in sectors reliant on global demand. Meanwhile, the depreciation of the U.S. dollar against major currencies has provided a modest tailwind to multinational corporations, though this effect has been offset by the broader selloff in equities. The divergence between bond and equity markets reflects a reevaluation of growth versus value, with investors increasingly favoring companies with tangible assets and predictable cash flows over speculative growth plays.
Corporate earnings reports have further influenced market sentiment, with mixed results across industries. While tech giants like Apple and Microsoft have delivered results that align with expectations, others such as Caterpillar and Innio have faced headwinds from overcapacity in industrial sectors and regulatory headwinds in the energy infrastructure space. The downgrade of Caterpillar by analysts, citing concerns over AI-driven demand saturation and environmental regulations, exemplifies the growing scrutiny of long-term growth narratives in the face of macroeconomic headwinds. Similarly, the sharp decline in Innio’s stock following its underwhelming revenue guidance highlights the market’s sensitivity to execution risks in emerging sectors, particularly those tied to technological disruption.
The broader implications of today’s market moves extend beyond immediate price action, influencing investor behavior and capital allocation strategies. The Fed’s hesitation to act has created a vacuum in policy direction, prompting investors to reassess the risk-reward profiles of various asset classes. The emphasis on AI as a driver of future growth has not insulated equities from short-term volatility, as the market grapples with the dual challenges of inflation and geopolitical instability. Meanwhile, the performance of HALO stocks and the resilience of capital-intensive industries suggest a potential shift toward defensive positioning, as investors prioritize companies with durable competitive advantages and stable cash flows.
In conclusion, today’s market dynamics reflect a delicate balance between monetary policy restraint, geopolitical uncertainty, and sectoral divergence. The Fed’s decision to hold rates steady has catalyzed a broad selloff, with technology and energy sectors bearing the brunt of the repricing. The interplay between inflationary pressures, energy market volatility, and corporate earnings outcomes has created a complex landscape for investors, necessitating a nuanced approach to risk management. As the market continues to navigate these challenges, the emphasis on tangible assets, operational efficiency, and strategic alignment with macroeconomic trends will likely shape the trajectory of equity markets in the near term. The coming weeks will be critical in determining whether the Fed’s cautious stance can stabilize inflation without derailing growth, or whether further policy adjustments will be required to address persistent economic imbalances.
Watch List
CWH
Camping World Holdings, Inc. recently announced its financial results for the three and six-month periods ending June 30, 2026, as detailed in a press release furnished as Exhibit 99.1 to this Form 8-K. While the specifics of the results are contained within the attached press release, this filing serves to notify the public of the company’s performance update. This announcement represents a standard reporting event, providing investors with information regarding the company’s financial standing and operational outcomes for the specified period. The filing fulfills the requirement to disseminate this information promptly to the market.
FBRT
Franklin BSP Realty Trust, Inc. (FBRT) announced its second-quarter 2026 financial results, demonstrating continued growth and strategic initiatives. The company reported GAAP net income of $16.3 million, or $0.12 per diluted common share, alongside distributable earnings of $28.3 million, or $0.25 per diluted common share on a fully converted basis. Notably, FBRT increased its book value per share by $0.11 through common stock repurchases totaling $16.0 million, bringing the book value to $14.24 per diluted common share. The company’s portfolio risk rating improved to 2.4, reflecting enhanced stability. FBRT continued to actively manage its $4.3 billion loan portfolio, securing $166.7 million in new loan commitments with a weighted average spread of 238 basis points and funding $248.4 million in principal balance. The company also closed an $880.4 million Commercial Real Estate Collateralized Loan Obligation (CLO), furthering its investment strategy. Distributable Earnings before realized losses reached $30.2 million, or $0.28 per diluted common share on a fully converted basis. Furthermore, the Board of Directors reauthorized a $50.0 million share repurchase program, and the company declared a quarterly common stock cash dividend of $0.20. With total liquidity at $796.7 million, FBRT remains well-positioned for future growth and distributions.
BNL
Broadstone Net Lease, LLC has secured an amendment to its existing credit agreement, significantly expanding its borrowing capacity. The amendment, signed by a diverse group of lenders including JPMorgan Chase, Capital One, Bank of Montreal, and numerous regional banks, increases the total revolving credit commitment to $1 billion. This includes a $111.5 million revolving credit facility and a $500 million term loan facility. The lenders are providing a combined $601.5 million in total commitments, reflecting confidence in Broadstone Net Lease’s operations. Notably, the amendment also establishes a $50 million letter of credit facility to further bolster the company’s financial resources. This expanded credit access will support Broadstone Net Lease’s ongoing portfolio management and strategic initiatives.
TDOC
Teladoc Health, the global leader in virtual care, reported a mixed second-quarter 2026 financial performance. Revenue decreased by 4% to $606.9 million compared to the prior year’s $631.9 million, driven by a 9% decrease in access fees revenue. The company’s net loss narrowed to $38.9 million, or $0.21 per share, compared to $32.7 million, or $0.19 per share, in the prior year. Adjusted EBITDA fell by 5% to $65.7 million. The Integrated Care segment showed solid performance, with revenue up 1% to $394.3 million and an EBITDA margin of 16.5%, largely due to the successful launch of the Teladoc One connected care model. However, the BetterHelp segment experienced a 12% revenue decline to $212.6 million and a lower 0.2% EBITDA margin, primarily due to increased pressure on cash pay revenue and challenges scaling insurance coverage. Despite near-end-of-quarter insurance revenue reaching expectations, the company accelerated the nationwide insurance rollout and focused on supporting insurance growth. Looking ahead, Teladoc anticipates 2026 insurance revenue within its previously communicated range, but has lowered its BetterHelp segment revenue outlook. The company continues to prioritize its strategic initiatives and is addressing the near-term challenges within the BetterHelp segment with urgency and discipline. Capex remained relatively stable at $28.9 million for the second quarter and $64.7 million for the six-month period. The company’s outlook is based on current market conditions and expectations, acknowledging the inherent uncertainties involved in its operations.
UBS
Okay, here's a breakdown of the provided text, categorized for clarity and highlighting key information: I. Executive Summary & Disclaimer * UBS Group AG Interim Consolidated Financial Report: This document presents the financial results of UBS Group AG and its significant regulated subsidiaries as of June 30, 2026. * Forward-Looking Statements: A significant disclaimer emphasizes that the report contains forward-looking statements, which are subject to risks and uncertainties. UBS disclaims any obligation to update these statements. II. Key Financial Metrics (as of June 30, 2026) * Total Assets: USD 1,707.3 billion * Total Liabilities: USD 1,617.9 billion * Net Profit/Loss Attributable to Shareholders: USD 3,082 million (net loss) * Key Ratios: * Cost/Income Ratio: (Defined - efficiency metric) * Capital and Leverage Ratios: (Detailed breakdown of ratios, including Tier 1 capital, going concern capital, etc.) – These are presented in a table format (not fully reproduced here). * Net New Money: USD 91.0 billion * Net New Loans: USD 23.9 billion * Net New Fee-Generating Assets: USD 10.4 billion III. Segment Reporting (Personal & Corporate Banking) * Revenue Breakdown: Details the components of revenue, primarily focusing on recurring net fee and commission income. * Key Metrics: Includes metrics like net new money, reflecting growth in customer deposits. IV. Regulatory & Legal Information * Regulatory Compliance: Highlights UBS’s adherence to regulations like IFRS Accounting Standards, FINMA Ordinance, and US Department of Justice requirements. * Credit Suisse Acquisition: Acknowledges the integration of Credit Suisse into UBS, and the ongoing legal and regulatory matters related to the acquisition. * Form 6-K Filing: States that this report is incorporated into filings with the SEC (Securities and Exchange Commission) – specifically Forms 6-K, F-3, S-8, and related prospectuses. V. Detailed Tables & Notes (Summarized) * Financial Instruments Breakdown:
VTR
Ventas, Inc. (NYSE: VTR) reported strong second-quarter 2026 results, driven by continued momentum in its senior housing portfolio and a robust demand for aging-in-place accommodations. Chairman and CEO Debra A. Cafaro highlighted the significant demographic trends, with the baby boomer generation reaching 80 years of age and historic lows in new senior housing supply, creating a favorable multi-year growth opportunity. Ventas is increasing its 2026 investment volume expectations to $4.5 billion, following $3 billion in prior investments and a growing investment pipeline. The company achieved a net income attributable to common stockholders of $0.14 per share and normalized funds from operations (FFO) of $0.97 per share, up 9% year-over-year, largely due to increased investment activity. Total company net operating income (NOI) grew by 17%, with the senior housing operating portfolio (SHOP) experiencing a 16% year-over-year increase, fueled by 9% revenue per occupied room growth and a 210 basis point margin expansion. Year-to-date, Ventas closed $3.4 billion in senior housing investments. To fund these investments, the company settled $2.6 billion through equity forward sales agreements and has $1.6 billion remaining. Ventas’s financial strength has strengthened, with its net debt-to-further adjusted EBITDA ratio improving to 4.7x. Looking ahead, Ventas is raising its full-year guidance, anticipating a significant increase in growth driven by its expanded investment strategy. The company remains focused on delivering exceptional environments to support an aging population, solidifying its position within the longevity economy.
CHRW
Robinson Worldwide Inc. delivered strong Q2 2026 results, demonstrating a commitment to “higher highs and higher lows” across its transportation segments. Operating margins in both North American Surface Transportation (NAST) and Global Forwarding (GF) met targets despite a trough in the freight cycle, reflecting disciplined revenue management and operational improvements. NAST continued its market share gains, outperforming the Cass Freight Shipment Index for the 13th consecutive quarter, driven by lean AI productivity gains – delivering year-over-year improvements of over 15% and more than 60% since 2022. The company achieved a 20% year-over-year increase in adjusted operating income, largely due to scalable operations and operating leverage. In NAST, disciplined pricing and capacity procurement maintained adjusted gross profit per shipment despite rising spot market costs, while GF saw increased air freight rates due to global supply chain disruptions. Key highlights included a 33.5% year-over-year increase in air AGP per metric ton and a 1.0% increase in ocean volume for GF. Robinson Worldwide’s financial performance was bolstered by $4.9 billion in total revenues, a 19.3% increase year-over-year, and $738 million in adjusted gross profits, up 6.5%. The company’s adjusted net income per share increased by 23.8% to $1.56. Furthermore, the company returned $301 million to shareholders through share repurchases and maintains a consistent dividend history. Looking ahead, the company is focused on continued operational improvements, leveraging AI technologies, and strategic acquisitions, including the recently closed DeSpir Logistics acquisition, to drive sustainable growth and deliver value to its shareholders.
GBFH
GBank Financial Holdings Inc. recently announced its second-quarter financial results for the period ending June 30, 2026, via a press release furnished as Exhibit 99.1 to this Form 8-K, which is incorporated herein. Simultaneously, the company reported a separation of service for Jeffrey E. Whicker, who previously served as Executive Vice President and Chief Financial Officer for both GBank Financial Holdings Inc. and its wholly-owned subsidiary, GBank. This departure, effective July 24, 2026, was outlined in his Employment Agreement dated August 1, 2022, and includes a twelve-month continued base salary alongside continued participation in benefit plans, all subject to the terms of the agreement. The filing also incorporates the company’s Cover Page Interactive Data File formatted as Inline XBRL (Exhibit 104). Investors can access the full press release detailing the financial results within the attached exhibit.
NEU
NewMarket Corporation reported strong financial results for the second quarter and first half of 2026, demonstrating solid performance across its key segments. Net income for the first half reached $251.8 million, or $27.14 per share, a significant increase compared to $237.2 million, or $25.11 per share, in the prior year. The second quarter saw net income of $133.8 million, or $14.54 per share, up from $111.2 million, or $11.84 per share, during the same period last year. Driven by implemented surcharges and operational efficiencies, the petroleum additives segment experienced a notable increase in operating profit, boosted by higher raw material costs related to supply chain disruptions in the Middle East. Specialty materials sales and operating profit also increased, particularly due to investments in expanding production capacity for critical aerospace and defense chemicals. The company maintained a strong focus on shareholder value, funding capital expenditures, paying dividends, and executing a share repurchase program, resulting in a reduced Net Debt to EBITDA ratio. Despite ongoing challenges like the conflict in the Middle East and fluctuating macroeconomic conditions, NewMarket remains confident in its strategic approach, emphasizing technology investments, cost control, and a robust global supply chain. The company’s dedicated team continues to prioritize long-term value creation and innovation, solidifying NewMarket’s position within the petroleum additives and specialty materials markets.
IAN Financial Vision is an AI-native financial research platform combining proprietary knowledge graphs, quantitative valuation models, and large language models to generate point-in-time investment research. All reports are produced using a structured research workflow with human review prior to publication..