In today's volatile market landscape, geopolitical tensions and macroeconomic pressures are shaping investor sentiment and sector dynamics. The escalation of US-Iran tensions has heightened geopolitical risk, contributing to market uncertainty. This backdrop of volatility is compounded by persistent inflationary pressures, which continue to challenge central banks worldwide, including the Federal Reserve's recent decision to maintain interest rates steady, signaling a cautious approach amidst economic uncertainties. In the corporate sphere, Google's recent earnings report has underscored the challenges tech giants face in balancing high investment costs with revenue growth. The company's disappointing performance, particularly in its core advertising business, highlights the broader struggle within the sector to monetize AI advancements effectively. This has led to a sharp decline in Google's stock, reflecting investor concerns over the return on its substantial investments in AI and cloud infrastructure. Conversely, Microsoft has demonstrated resilience, with its cloud business driving growth and offsetting some of the sector's broader challenges. The company's ability to manage costs while expanding its AI capabilities has provided a counterbalance to the tech sector's mixed performance, offering a glimmer of hope for investors seeking stability in a turbulent market. The energy sector, buoyed by geopolitical tensions and supply chain disruptions, continues to perform robustly. Oil giants like ExxonMobil and Chevron are poised to report record profits, benefiting from elevated oil prices and strategic investments in refining and production capabilities. This sector's strength underscores the cyclical nature of commodities markets, where geopolitical events can significantly impact supply and demand dynamics. In the airline industry, carriers are navigating a complex environment marked by fluctuating fuel prices and changing consumer travel patterns. The sector's recovery remains uneven, with some airlines reporting improved performance while others struggle to regain pre-pandemic levels of demand. The semiconductor industry, a critical component of the global supply chain, faces its own set of challenges. Companies like Nvidia and Intel are grappling with supply constraints and competitive pressures, even as demand for chips remains strong, driven by the ongoing digital transformation and the rise of AI technologies. As investors digest these developments, the interplay between macroeconomic factors and corporate performance will continue to shape market dynamics. The Federal Reserve's cautious stance on interest rates, coupled with ongoing geopolitical tensions, suggests a period of heightened uncertainty ahead. Investors will need to remain vigilant, balancing the potential for growth in sectors like technology and energy against the risks posed by inflation and geopolitical instability. In summary, today's market is a complex tapestry of geopolitical, macroeconomic, and corporate factors. The tech sector's struggles with monetizing AI investments, the energy sector's resilience amid geopolitical tensions, and the semiconductor industry's supply chain challenges all reflect the broader uncertainties facing investors. As the market navigates these turbulent waters, the ability to adapt to rapidly changing conditions will be crucial for those seeking to capitalize on emerging opportunities while mitigating risks.
Companies Reporting Earnings Today
| Symbol | Price | Change | MarketCap |
|---|---|---|---|
| AMZN | 254.6000 | 0.59% | 2746191980000 |
| LLY | 1288.7800 | 0.54% | 1213202074460 |
| MA | 610.3100 | 0.08% | 534637602679 |
| INTC | 95.5300 | 1.91% | 504981635679 |
| MRK | 141.1200 | -0.49% | 348167261555 |
| CAT | 713.3800 | 0.01% | 327922951500 |
| SHEL | 105.1900 | 0.39% | 298867931800 |
| LIN | 508.1600 | -0.10% | 234251679630 |
| TTE | 92.8800 | 0.57% | 206582948688 |
| SNDK | 1404.7700 | 7.66% | 203027986080 |
| GILD | 159.2000 | 0.08% | 197400860676 |
| BUD | 80.9800 | -0.48% | 160860922677 |
| BBVA | 25.0100 | -0.91% | 137642864857 |
| BMY | 60.5700 | -1.59% | 123726944700 |
| MO | 72.9800 | -0.69% | 121857911719 |
| SBUX | 103.2000 | 0.16% | 117648000000 |
| SYK | 304.0000 | 0.86% | 116606192000 |
| SOMN | 48.2800 | -0.66% | 105280947191 |
| TT | 448.4700 | -2.73% | 98673794189 |
| ASX | 43.9200 | 4.42% | 96956637168 |
| ING | 32.8900 | 1.00% | 93440960228 |
| PWR | 606.8900 | 4.85% | 91241663270 |
| ICE | 155.9600 | 0.33% | 87555164200 |
| EPD | 38.0600 | 2.39% | 82189808800 |
| LYG | 5.5000 | 1.85% | 79193345468 |
| MDLZ | 61.8700 | -0.77% | 78965299700 |
| HWM | 195.3200 | 1.73% | 77893889253 |
| RSG | 233.4000 | -0.96% | 71470114200 |
| AJG | 260.4200 | 0.54% | 66756323220 |
| DLR | 179.7700 | 0.42% | 66694441153 |
| TAK | 20.1500 | -0.59% | 64127098824 |
| DLR-PL | 17.5100 | -1.24% | 61863973648 |
| LNG | 297.7700 | -0.66% | 61499676228 |
| MPWR | 1211.2200 | -0.06% | 59522984460 |
| MSTR | 145.1600 | 2.66% | 58416883960 |
| CRH | 86.5400 | 0.90% | 57573721582 |
| VALE | 11.4700 | -3.12% | 48813600761 |
| LHX | 260.6100 | 0.47% | 48529491150 |
| DLR-PK | 20.0500 | 0.54% | 47496047910 |
| CARR | 56.2700 | -2.70% | 46384770957 |
| ILMN | 288.7900 | 3.33% | 43607290000 |
| STM | 48.5200 | -0.33% | 43306292473 |
| AMP | 489.8800 | -0.60% | 43272677755 |
| ABEV | 2.7800 | -3.14% | 42857832537 |
| COIN | 162.3200 | 0.76% | 42826010478 |
| KB | 115.3800 | 2.56% | 40773907440 |
| ARES | 123.8200 | 1.33% | 40664339852 |
| DHI | 143.0000 | -2.73% | 39997281181 |
| TWLO | 253.7700 | -0.31% | 38972727750 |
| RBLX | 53.2800 | -2.18% | 38061948625 |
| WEC | 110.5000 | -0.83% | 36006314500 |
| RMD | 250.1700 | -0.25% | 35183719421 |
| VMC | 265.0000 | 0.95% | 34338435000 |
| STRC | 99.9200 | 0.43% | 33054335360 |
| HSY | 163.7700 | -0.45% | 32905596812 |
| RKT | 11.5700 | -2.28% | 32673844109 |
| CQP | 65.0000 | -1.16% | 31463750760 |
| ALNY | 232.4000 | 2.47% | 31097211600 |
| TECK | 63.0400 | 1.22% | 30448320000 |
| STRF | 101.7800 | 0.67% | 30236058185 |
| EME | 678.5500 | 1.83% | 29930773324 |
| CTSH | 66.3600 | 0.21% | 29891477709 |
| WTW | 321.6300 | 0.62% | 29870401097 |
| DXCM | 78.6200 | 0.08% | 29668121820 |
| IR | 75.4500 | -0.11% | 29274556918 |
| WST | 403.6400 | 1.34% | 28406487912 |
| FTI | 71.4000 | 0.03% | 28000537303 |
| QSR | 74.5100 | 0.70% | 25985963796 |
| RDDT | 134.7000 | -1.29% | 25915812456 |
| TW | 119.8200 | 0.13% | 25884505993 |
| VLTO | 102.8000 | -0.38% | 25061956380 |
| ENTG | 159.3200 | 6.21% | 24344096000 |
| INCY | 116.8700 | 0.23% | 23689285575 |
| EIX | 58.8300 | 1.10% | 22638606385 |
| ATI | 165.3000 | -0.51% | 22508964310 |
| TROW | 104.0000 | 0.36% | 22184864000 |
| THC | 268.5000 | 2.46% | 21619351500 |
| XPO | 181.6900 | -3.32% | 21273439826 |
| INSM | 96.9800 | 2.13% | 21178638161 |
| STRK | 70.7750 | 0.89% | 21025319493 |
| BG | 100.8000 | -0.55% | 19365607598 |
| FSLR | 176.3000 | 0.26% | 18946923624 |
| DLR-PJ | 17.6450 | -0.79% | 18920910126 |
| SOJC | 18.1600 | -0.33% | 18150447440 |
| LNT | 69.3700 | -0.96% | 17986579570 |
| APG | 41.3750 | 1.38% | 17880632288 |
| FTAI | 167.1400 | 5.34% | 17166463190 |
| FTAIM | 26.1200 | 0.00% | 17166463166 |
| TPG | 44.5900 | 0.02% | 17092918218 |
| WCC | 347.2200 | 2.39% | 16921021566 |
| RIVN | 11.6700 | -1.27% | 16850874327 |
| EXEL | 66.2800 | 1.42% | 16659814901 |
| KIM-PL | 18.7800 | 0.21% | 16360639138 |
| H | 173.3500 | 0.22% | 16356740186 |
| FDXF | 108.3300 | -0.16% | 16195903516 |
| DUKB | 20.4800 | 0.15% | 15926702080 |
| KIM-PM | 18.8200 | -0.37% | 15773633419 |
| KIM | 23.4200 | -1.18% | 15709887116 |
| KIM-PN | 59.4300 | -0.92% | 15678820282 |
| OWL | 9.6700 | 3.87% | 15116272195 |
| MTZ | 181.0000 | 2.55% | 14535195588 |
| BBIO | 70.8200 | 2.09% | 13844814260 |
| WY | 19.1900 | -1.06% | 13830923840 |
| AVY | 180.7000 | -0.56% | 13694917259 |
| GDDY | 106.5400 | 0.31% | 13493077920 |
| TXT | 78.3200 | 0.18% | 13470021840 |
| BAX | 25.4600 | 2.17% | 13162718135 |
| DTM | 124.8500 | -2.87% | 12736572750 |
| SKM | 31.8200 | 1.11% | 12215381073 |
| PINS | 20.9200 | 1.65% | 11847268253 |
| DVA | 183.9300 | 1.23% | 11734734000 |
| BWA | 55.9300 | 0.36% | 11391059179 |
| ERIE | 246.3900 | -0.20% | 11380532349 |
| TLK | 11.4300 | -2.81% | 11267802105 |
| GLPI | 38.4500 | -0.93% | 11185874000 |
| HII | 279.2600 | -0.73% | 11004128037 |
| KYMR | 122.5100 | 4.20% | 10077377106 |
| CFR-PB | 15.4800 | -0.48% | 9882616320 |
| CFR | 157.0100 | -0.36% | 9757983088 |
| LTH | 43.1400 | -2.13% | 9640148092 |
| DRS | 35.5000 | -1.36% | 9474648783 |
| TFII | 112.1100 | -2.12% | 9214657230 |
| SIRI | 27.3200 | 0.26% | 9208667462 |
| CUBE | 40.3300 | -0.69% | 9128976358 |
| PBF | 73.2800 | -0.48% | 8686379489 |
| SAIA | 324.6200 | -4.76% | 8659108652 |
| OSK | 137.9300 | 2.79% | 8515770614 |
| SPXC | 165.2000 | 0.08% | 8274184072 |
| IDCC | 320.5600 | -2.51% | 8272373604 |
| AOS | 60.8600 | -1.93% | 8271395814 |
| ATR | 127.1700 | 0.52% | 8085612175 |
| IDA | 139.7300 | -0.75% | 8082262660 |
| MHK | 127.7800 | 2.18% | 7722780418 |
| EMN | 66.6700 | 0.83% | 7622155955 |
| AXTA | 34.6400 | 0.35% | 7413652696 |
| NCLH | 16.0600 | 1.97% | 7374556807 |
| ACA | 149.1500 | 0.08% | 7324280562 |
| BVN | 28.6100 | -0.42% | 7266564093 |
| AGCO | 102.1600 | -1.20% | 7154441435 |
| FSS | 113.4500 | -2.04% | 6925169520 |
| ALGM | 35.3700 | 4.09% | 6593038740 |
| INGM | 28.4000 | 0.35% | 6533048244 |
| LGND | 318.7800 | 2.26% | 6355073437 |
| TAL | 10.0600 | -1.47% | 6121728523 |
| HR | 17.5300 | -2.01% | 6082871294 |
| BLDR | 55.8800 | -1.45% | 6012464480 |
| MBLY | 7.0600 | 2.77% | 6002324477 |
| GATX | 168.8700 | 0.83% | 5961965144 |
| CROX | 119.6900 | 0.16% | 5738549019 |
| CACC | 544.9000 | 0.44% | 5656388940 |
| CNX | 38.0500 | -1.37% | 5629255388 |
| MMSI | 92.2100 | -1.41% | 5505895984 |
| PTCT | 63.0200 | 1.50% | 5259699616 |
| SNDR | 29.7100 | -4.50% | 5208189828 |
| POR | 44.2700 | -0.85% | 5206494650 |
| RYAN | 42.6200 | 0.57% | 5202964360 |
| AX | 91.4800 | -0.89% | 5201370114 |
| FND | 47.5500 | -1.72% | 5063599500 |
| KBR | 40.1400 | -0.22% | 5060369520 |
| CNO | 54.3800 | -0.11% | 5031313732 |
| CNO-PA | 16.2000 | -0.06% | 5031313720 |
| LAUR | 36.3600 | -3.40% | 5008566730 |
| MEOH | 63.5500 | -0.31% | 4916498914 |
| GVA | 111.6400 | 1.05% | 4885870120 |
| CSWI | 305.1000 | 0.00% | 4853055149 |
| CSW | 292.4700 | -2.72% | 4765359945 |
| CUZ | 28.5100 | -1.23% | 4692803020 |
| TFSL | 16.6700 | -0.36% | 4674980726 |
| CCC | 7.6700 | -0.39% | 4530615310 |
| BC | 68.8500 | 1.68% | 4461302918 |
| BC-PC | 22.1500 | -1.03% | 4461302912 |
| FCN | 159.1000 | 0.19% | 4393005560 |
| LKQ | 17.1900 | 0.53% | 4349105858 |
| INDV | 34.7700 | 0.14% | 4338252900 |
| ITGR | 126.5500 | -0.15% | 4302328576 |
| CVSA | 126.5000 | -2.14% | 4283316312 |
| FHI | 56.7800 | 0.83% | 4239210982 |
| AXTI | 64.3800 | 10.56% | 4221602616 |
| BDC | 106.6600 | -0.76% | 4168079852 |
| GTX | 22.3300 | 1.45% | 4164397935 |
| CGAU | 21.1800 | 0.76% | 4142977440 |
| CVCO | 532.5700 | -1.23% | 4095144823 |
| KTB | 74.3700 | -0.65% | 4064589719 |
| SLGN | 37.9300 | -1.48% | 4008518260 |
| TGS | 25.3000 | -0.24% | 3808970736 |
| CDP | 33.4700 | -1.36% | 3795832700 |
| IEP | 5.3100 | -4.50% | 3774958650 |
| CDNA | 72.1300 | 2.27% | 3731587846 |
| TDS-PU | 18.4300 | -0.75% | 3711183968 |
| SKYW | 95.2700 | -0.43% | 3699174523 |
| EXPO | 77.1100 | 0.86% | 3666279771 |
| TDS-PV | 16.6600 | -1.65% | 3653687274 |
| HG | 34.6800 | -2.25% | 3419946733 |
| BFAM | 69.2900 | -1.80% | 3369940353 |
| PFSI | 63.4200 | -1.17% | 3294768696 |
| AAMI | 91.2700 | -2.79% | 3239183983 |
| TNET | 70.4100 | -1.69% | 3232152603 |
| MIAX | 31.9800 | -1.69% | 3173404054 |
| OSIS | 200.6700 | -0.11% | 3156177894 |
| COLM | 60.9000 | -0.44% | 3117665515 |
| HTGC | 16.6100 | 0.15% | 3108794040 |
| HCXY | 24.2000 | -0.17% | 3108794025 |
| SPSC | 85.5900 | -0.75% | 3081257118 |
| HOG | 29.5200 | 0.27% | 3072234960 |
| EFXT | 25.0000 | 4.12% | 3052575000 |
| SXI | 244.5500 | 0.57% | 3003432266 |
| DBRG | 16.0000 | 0.13% | 2955695728 |
| CWT | 47.1500 | -1.40% | 2915713565 |
| DBRG-PJ | 15.4600 | 0.19% | 2898672700 |
| DBRG-PI | 15.1000 | 1.82% | 2831174500 |
| DBRG-PH | 14.8000 | 0.82% | 2774926000 |
| HGV | 35.5300 | -0.56% | 2761538872 |
| UZE | 15.3700 | -0.19% | 2748885937 |
| UZD | 17.5200 | -1.41% | 2748885933 |
| UZF | 15.3200 | -1.10% | 2748885923 |
| KWR | 156.9200 | -0.11% | 2700232598 |
| TR | 35.7200 | 3.42% | 2684824575 |
| DXC | 16.0900 | 1.58% | 2570844110 |
| FTRE | 25.8800 | 5.94% | 2461188000 |
| PEB | 21.4700 | 0.75% | 2422739210 |
| SUPN | 41.0800 | 0.29% | 2391846028 |
| CLBK | 10.6700 | -1.66% | 2384049124 |
| MD | 28.9100 | 0.24% | 2349032903 |
| PEB-PH | 17.8300 | -0.89% | 2313649364 |
| PEB-PG | 19.4200 | -1.55% | 2281744025 |
| PATK | 69.9300 | -2.77% | 2246032719 |
| PRLB | 90.9100 | 1.68% | 2174739565 |
| STGW | 8.8300 | -0.23% | 2158718232 |
| INVX | 30.3700 | -2.44% | 2123950246 |
| PHIN | 57.6800 | -0.26% | 2113285031 |
| BFLY | 7.8100 | 5.83% | 2079687295 |
| TBBK | 50.4200 | -1.20% | 2056470910 |
| ESTA | 68.9700 | 3.02% | 2055436422 |
| TRN | 25.5600 | 0.24% | 2036352062 |
| SAH | 63.1300 | -0.86% | 1995842450 |
| NSP | 51.6500 | -0.27% | 1972787245 |
| NMRK | 12.0600 | 5.05% | 1928912580 |
| MTX | 61.9300 | -0.96% | 1927804231 |
| OLN | 16.4700 | -0.51% | 1877283540 |
| WKC | 36.6100 | 0.63% | 1872660808 |
| PMTW | 24.9600 | -0.16% | 1788314237 |
| BXMT | 10.5600 | -1.22% | 1779824640 |
| ATEC | 11.4500 | 5.34% | 1768463950 |
| NEXT | 6.5100 | 0.93% | 1732864350 |
| PGY | 20.4700 | 3.54% | 1707727068 |
| PGYWW | 0.0128 | 1.59% | 1707727068 |
| STOK | 26.4100 | 1.07% | 1704136942 |
| ALHC | 8.1800 | 1.61% | 1696818300 |
| NVCR | 14.1700 | -3.08% | 1650037553 |
| MPT | 2.7500 | 1.29% | 1642300000 |
| OMCL | 35.9500 | -2.20% | 1634966779 |
| HUBG | 26.2700 | -4.30% | 1591400006 |
| NEXA | 11.8200 | -1.09% | 1565424382 |
| RES | 6.7300 | 1.97% | 1491751610 |
| BAND | 48.4500 | -1.66% | 1464294660 |
| PWP | 12.9400 | 1.33% | 1422610117 |
| TRS | 39.3600 | -0.38% | 1411995484 |
| FMBH | 50.5200 | -0.96% | 1343928594 |
| REAL | 11.0600 | 0.64% | 1332594272 |
| FOR | 25.9200 | -1.29% | 1322376192 |
| DFIN | 53.1200 | -0.64% | 1305976448 |
| TK | 14.6300 | 0.41% | 1282924743 |
| COUR | 4.7000 | -1.05% | 1242680000 |
| ASBH | 18.8700 | -1.26% | 1226511939 |
| MYE | 32.2000 | -0.53% | 1211301854 |
| PEB-PE | 19.5000 | -1.17% | 1175307744 |
| PEB-PF | 19.4700 | -1.62% | 1166233316 |
| NPK | 150.7800 | 0.21% | 1075976635 |
| FET | 90.9100 | 1.07% | 1027672640 |
| STRD | 71.0000 | 1.62% | 995719691 |
| HIPO | 37.7100 | -1.54% | 995143558 |
| UPBD | 16.9100 | -0.24% | 985842854 |
| NPKI | 11.3000 | 0.27% | 959481802 |
| SBSI | 31.6300 | -0.44% | 942826407 |
| SIFY | 12.5800 | 2.61% | 911227444 |
| PMT-PB | 20.2100 | 0.60% | 888374911 |
| DFH | 9.7200 | -5.36% | 880001366 |
| PMT-PA | 19.8500 | -1.00% | 877365613 |
| FRBT | 17.2400 | -1.88% | 875177911 |
| TALK | 5.2500 | 0.00% | 870575034 |
| MCS | 28.2200 | -0.14% | 870083499 |
| RJET | 18.4800 | 1.65% | 865224360 |
| DGICB | 25.9000 | 1.33% | 846949037 |
| ARI | 6.5600 | -0.46% | 843250956 |
| FISI | 40.7700 | -0.07% | 803428297 |
| OSPN | 20.0800 | -1.38% | 739992176 |
| CVLG | 28.9700 | -3.21% | 735194229 |
| CCB | 47.1300 | 3.22% | 720443319 |
| PFIS | 71.2000 | 0.32% | 712740480 |
| GDYN | 8.7500 | 1.04% | 709860209 |
| AROW | 38.0300 | -1.07% | 704456311 |
| DGICA | 18.6300 | -1.11% | 691532149 |
| TSAT | 45.5500 | -2.92% | 688101849 |
| CARE | 30.2200 | -0.33% | 669793058 |
| RRBI | 101.4000 | -1.02% | 667628754 |
| WTI | 4.2200 | 1.69% | 636979257 |
| PMT | 7.2700 | 0.14% | 633961448 |
| PMTU | 25.2100 | 0.08% | 633961441 |
| FBIZ | 72.7500 | -0.04% | 608795280 |
| PMT-PC | 15.6300 | 0.13% | 598170181 |
| WNC | 13.8200 | 0.22% | 562987731 |
| FMC | 4.4700 | -5.20% | 559763970 |
| BWFG | 66.8900 | 0.07% | 533245207 |
| IVR-PC | 23.1800 | -0.30% | 531556991 |
| ACIC | 10.8700 | -0.64% | 526803680 |
| WTBA | 30.4600 | 0.10% | 519151102 |
| PHAT | 6.2800 | 4.84% | 508057866 |
| IVR | 5.4500 | -1.18% | 505886816 |
| PBFS | 18.0700 | -0.61% | 448889519 |
| MNRO | 14.3000 | 0.99% | 447076058 |
| TWI | 6.6200 | -0.60% | 427270370 |
| GLOP-PB | 25.8850 | 0.10% | 415107417 |
| GTE | 11.5700 | 0.43% | 409346600 |
| GLOP-PC | 25.3722 | -0.59% | 406883848 |
| PCB | 28.9700 | -0.03% | 406872120 |
| GLOP-PA | 25.2450 | 0.10% | 404844017 |
| ACCO | 4.3800 | -2.23% | 404307148 |
| CZFS | 83.8400 | -0.49% | 403258243 |
| VGZ | 2.7000 | 3.85% | 394121700 |
| STRZ | 22.5000 | 4.31% | 385293825 |
| MVBF | 29.6400 | -0.84% | 383749080 |
| RMNI | 4.0250 | 0.37% | 375757900 |
| SLP | 18.5000 | 0.00% | 374159503 |
| XRX | 2.7900 | 9.84% | 366367486 |
| WSBF | 19.7700 | -0.20% | 355405844 |
| GECCI | 25.1500 | 0.56% | 352054730 |
| ARTNA | 33.7900 | -0.73% | 348953419 |
| LVWR | 1.6000 | -13.98% | 328659931 |
| PACK | 3.7800 | -4.67% | 324166332 |
| CVEO | 30.2200 | -0.76% | 312381118 |
| CTNM | 9.1500 | 1.78% | 301571492 |
| OPI | 13.3800 | 8.60% | 293738860 |
| FVRR | 8.0800 | -1.34% | 290481882 |
| FULC | 3.7500 | 1.35% | 286114714 |
| GECCG | 24.5000 | -1.01% | 283425800 |
| FBLA | 17.2600 | 0.35% | 275265552 |
| RWAYL | 25.2400 | 0.00% | 271995276 |
| BCYC | 3.8800 | 2.65% | 271572351 |
| HWBK | 39.1800 | -0.36% | 270368525 |
| MFIN | 11.5200 | 1.32% | 264502068 |
| VABK | 48.6900 | -1.99% | 264156883 |
| TROO | 2.1600 | -3.79% | 263865600 |
| ULBI | 15.6100 | 145.44% | 260113629 |
| ESCA | 18.5400 | 0.49% | 255223494 |
| STRT | 63.9800 | 0.64% | 254961068 |
| SILC | 44.1600 | 5.14% | 253814502 |
| INBK | 26.6600 | -0.56% | 232836976 |
| INBKZ | 25.2500 | -0.00% | 232836967 |
| FORR | 12.0400 | 0.17% | 229229560 |
| MRBK | 18.9600 | 1.28% | 226173840 |
| CELG-RI | 0.1100 | -5.90% | 224698100 |
| ASUR | 7.2300 | -0.28% | 208797339 |
| PDEX | 63.1900 | 1.48% | 204307804 |
| DMRC | 8.6300 | 9.38% | 194593132 |
| IMPP | 5.0500 | 1.41% | 189836656 |
| IMPPP | 25.7600 | -0.36% | 182735927 |
| NCMI | 1.7500 | -4.89% | 164623200 |
| BCBP | 8.5700 | 0.47% | 148802624 |
| MOLN | 3.7110 | -2.60% | 142150582 |
| FGBIP | 17.1000 | 0.59% | 140825255 |
| BOTJ | 29.0300 | -3.27% | 131893102 |
| MRDN | 10.0000 | -0.99% | 126410620 |
| ATOM | 3.0100 | 3.08% | 117462240 |
| PBHC | 16.7200 | -0.42% | 104978894 |
| LENZ | 3.2100 | 1.90% | 100859163 |
| FNWB | 10.3200 | 5.74% | 98159867 |
| SAMG | 10.4400 | 1.85% | 81659383 |
| GECCH | 24.7400 | 0.16% | 69309852 |
| PRTS | 8.1900 | 2.63% | 66328771 |
| ASPS | 5.6500 | 3.86% | 64524130 |
| DWSN | 2.0650 | 1.23% | 64129814 |
| RFL | 1.2100 | -2.42% | 61967488 |
| ATLX | 1.8950 | 0.80% | 57039121 |
| OFSSH | 23.4400 | -0.09% | 53650902 |
| OFS | 4.0000 | 0.00% | 53592312 |
| SRTS | 2.8200 | 1.08% | 46423006 |
| INMB | 1.5300 | 0.66% | 42463297 |
| KOSS | 3.4300 | 0.00% | 32469882 |
| FLNA | 0.6507 | 0.37% | 31433948 |
| NXTC | 6.3400 | 10.94% | 29020450 |
| BAFN | 6.4100 | 6.48% | 26325293 |
| DAIO | 2.5200 | 3.28% | 26196912 |
| DSY | 3.6200 | 8.06% | 17201777 |
| NKLA | 0.1830 | 0.00% | 15457589 |
| LRE | 1.1200 | 0.90% | 15278928 |
| GIGM | 1.2500 | 0.00% | 13815294 |
| CNSY | 1.7400 | 4.82% | 13205948 |
| PSQH | 3.3400 | 1.83% | 11241705 |
| WAFU | 1.4400 | -0.69% | 6351205 |
| PCSA | 1.8500 | 1.65% | 5176744 |
| DSS | 0.5119 | -1.75% | 5140756 |
| EJH | 1.3700 | -0.72% | 4384211 |
| SCKT | 0.3402 | -34.12% | 2820830 |
| ASPSW | 0.2250 | -7.64% | 2569545 |
| ASPSZ | 0.1932 | 13.65% | 2206383 |
| ISPC | 0.8740 | 0.22% | 2201248 |
| GMEX | 0.8432 | 5.40% | 133377 |
6-K/8-K Form Update
XRXDW
Xerox Corporation has entered into an Exchange Support Agreement with holders of its 5.500% Senior Notes due 2028 and certain investment advisors. The agreement facilitates an exchange offer to swap approximately $174.0 million of these notes for $690.00 in newly issued 10.250% Senior Secured First Lien Notes due 2030 and 3,872,062 shares of Xerox Holdings Corporation common stock. This move aims to restructure Xerox's debt obligations.
UPBD
Upbound Group, Inc. reported third-quarter 2026 results with consolidated revenue of $1.15 billion, up 37% year-over-year, and GAAP net earnings of $34 million. The company announced a $50 million share repurchase program, welcomed new leadership, and expanded through an integration agreement with Boost Mobile. Rent-A-Center reported same-store sales growth of 180 basis points and doubled its free cash flow to $121 million, reducing net leverage. Full-year revenue is expected between $4.68-$4.78 billion, with adjusted EBITDA of $510-$525 million and non-GAAP diluted EPS of $4.15-$4.30.
IDA
IDACORP, Inc. reported diluted earnings per share of $2.73 and $5.76 for the three and nine months ended September 30, 2026, respectively, up from $2.26 and $5.13 in the same periods in 2025. The company's customer growth, excluding large contract customers, increased by 5.8% in the nine months ended September 30, 2026, driven by a 2.2% year-over-year growth in Idaho Power's customer base. IDACORP's net income rose by $36.0 million in the three months ended September 30, 2026, compared to a decrease of $4.5 million in the same period in 2025, with a strong liquidity position of $100 million in IDACORP's net balance and $400 million in Idaho Power's net balance as of October 23, 2026.
VBIO
Valion Bio, Inc. (NASDAQ: VBIO) announced final data from a safety study of its lead biologic drug candidate, Entolimod, funded by the NIAID/RNCP. The study, conducted by the Armed Forces Radiobiology Research Institute (AFRRI), found no treatment-related toxicity in male C57BL/6 mice following a single dose, supporting progression to a fully funded therapeutic study evaluating survival and gastrointestinal recovery post-radiation exposure. Results showed stable body weight, unchanged hematologic profiles, and normal metabolic and organ function, providing encouraging preclinical safety data.
CART
Maplebear Inc. announced a 15% year-over-year increase in gross merchandise value to $10.528 billion and a 17% rise in total revenue to $1.095 billion for the third quarter ended September 30, 2026. The company agreed to be acquired by DoorDash, Inc. in a $17 billion cash-and-stock transaction, resulting in the cancellation of its earnings conference call and suspension of long-term financial guidance.
ATI
ATI Inc. reported a robust third quarter 2026 performance, with sales surging 26% year-over-year to $1.42 billion and net income attributable to ATI soaring 73% to $190 million. Adjusted EBITDA rose 46% to $328 million, with margins expanding to 23.0%, prompting the company to raise its full-year guidance by $35 million to $1.195 billion. Adjusted earnings per share increased to $1.46 from $0.85, reflecting strong operational efficiency and growth momentum.
DASH
DoorDash, Inc. reported third-quarter 2026 financial results, showcasing robust growth. Total Orders surged 28% year-over-year to 993 million, while Marketplace Gross Order Volume (GOV) increased 36% to $33.9 billion. Revenue jumped 34% to $4.6 billion, and GAAP net income rose 91% to $466 million. Additionally, DoorDash agreed to acquire Instacart for $65.00 per share, with at least 75% in cash and up to 25% in DoorDash stock.
CCC
CCC Intelligent Solutions Holdings Inc. announced its third quarter 2026 financial results, reporting revenue of $294.1 million, a 10.1% increase from the previous year. The company achieved adjusted EBITDA of $130.5 million, up 18.5% year-over-year. CCC is in the process of being acquired by a consortium led by GTCR and Elliott Investment Management in an all-cash transaction, with shareholders receiving $7.75 per share, valuing the enterprise at approximately $6.1 billion. The transaction is expected to close in the first quarter of 2027, pending regulatory and stockholder approvals.
LAUR
Laureate Education, Inc. reported robust financial performance for the third quarter and nine months ended September 30, 2026. Revenue surged 21% to $485.1 million in the third quarter, with operating income climbing 67% to $119.1 million and net income soaring 194% to $101.2 million, aided by a $25.4 million tax benefit. For the nine months, revenue increased 18% to $1,373.6 million, operating income grew 25% to $315.0 million, and net income rose 93% to $216.7 million, with adjusted EBITDA reaching $395.1 million, up 26% year-over-year. The company also boosted its share repurchase program by $150 million, underscoring its financial strength and commitment to shareholder returns.
ALGM
Allegro MicroSystems, Inc. reported a 29% year-over-year increase in sales to $277 million for the second quarter ended September 25, 2026, driven by strong performance in Automotive and Industrial end markets. GAAP earnings per share quadrupled to $0.12, while non-GAAP EPS doubled to $0.26. The company also announced a $25 million voluntary debt repayment, citing a strong balance sheet and anticipated free cash flow generation.
CRTO
Criteo S.A. appointed Jianchang "JC" Mao as its new independent director, effective October 28, 2026, replacing Edmond Mesrobian. Mao, a seasoned technology executive with over 30 years of experience in AI, digital advertising, and search, previously led global research, product, and engineering organizations at Google and Microsoft. The appointment is expected to bolster Criteo's Board and enhance innovation in commerce intelligence, particularly leveraging AI's transformative impact on commerce and advertising.
CELG-RI
Bristol Myers Squibb reported a 7% increase in third-quarter 2026 revenues to $13.1 billion, driven by a 12% growth in the Growth Portfolio and a 1% rise in the Legacy Portfolio. The company raised its 2026 revenue guidance to $49.75 billion to $50.25 billion and updated its non-GAAP EPS range to $6.35 to $6.55, accounting for a $(0.60) per share net impact from Acquired IPRD charges and licensing income. Bristol Myers Squibb also highlighted pipeline milestones, including regulatory approvals and positive data for therapies like Zenbexus and several oncology candidates.
CLX
The Clorox Company appointed Fabian Garcia as its new Chief Executive Officer, effective January 5, 2027, succeeding Linda Rendle, who steps down due to health reasons. Garcia, with over four decades of experience in global consumer products, previously served as CEO at Unilever North America and Colgate-Palmolive. He will join the Clorox Board of Directors and receive a compensation package including a $100,000 base salary, a $2 million short-term incentive target, and a $4.55 million long-term incentive target.
INCY
Incyte Corporation reported a 14% increase in third-quarter 2026 total revenue to $1.56 billion, driven by higher net sales across marketed products. Total net sales rose to $1.32 billion, with Jakafi® sales at $827 million (up 4%) and Opzelura® at $255 million (up 36%). The company raised its full-year guidance for Opzelura net sales to $1,100-$1,120 million, Hematology and Oncology to $890-$910 million, and total net sales to $5,210-$5,300 million.
PGYWW
Pagaya Technologies Ltd. reported record performance for the third quarter of 2026, with GAAP net income of $50 million, up 27% year-over-year, and Adjusted EBITDA of $130 million, up 22% year-over-year. Total revenue and other income reached $390 million, a 12% increase, driven by fee revenue and interest income growth, while network volume surged 29% to $3.6 billion. The company expanded its partner base and closed over $2 billion in committed capital, enhancing funding capacity and raising full-year guidance.
CROX
Crocs, Inc. reported strong third quarter 2026 results, with consolidated revenues of $1,043 million, up 4.6% on both reported and constant currency bases. The company raised its full-year 2026 enterprise revenue growth outlook to approximately 3% and repurchased approximately 2.0 million shares, representing $250 million in buybacks. Crocs also announced a conference call to discuss the results on October 29, 2026, at 8:30 am ET.
ENTG
Entegris, Inc. reported third-quarter 2026 financial results, with net sales of $1,006 million and non-GAAP diluted EPS of $1.23. The company anticipates fourth-quarter sales between $1,025 million and $1,055 million, with GAAP net income projected between $168 million and $181 million. Entegris operates in Materials Solutions and Advanced Purity Solutions segments, focusing on materials-based and contamination-control solutions, respectively.
TW
Tradeweb Markets Inc. reported third-quarter 2023 financial results, with revenues of $584.5 million, a 14.9% increase year-over-year, and $3.2 trillion in average daily volume, up 22.4%. International revenues grew by 22.4%, and net income reached $224.9 million, a 6.8% increase, while adjusted net income was $238.8 million, up 15.6%. The company also announced the acquisition of Trumid, its largest to date, to enhance its credit strategy and expand global credit market capabilities.
TPGXL
TPG Inc. reported its unaudited third quarter 2026 financial results, showing net income of $264 million, up from $199 million in the same period last year, with net income attributable to TPG Inc. rising to $100 million from $67 million. The company's operating profit margin increased to 21.6% from 16.3% in the prior year. TPG Inc. declared a quarterly dividend of $0.55 per share, payable on November 23, 2026, and expects to exceed its $50 billion fundraising target for 2026, having raised $15 billion in the third quarter and nearly $42 billion year-to-date.
FMBH
First Mid Bancshares, Inc. agreed to merge with Evergreen Bancshares, Inc., effective October 28, 2026, under which Evergreen will be merged into First Mid. The merger consideration involves an exchange ratio of 0.5 shares of Evergreen's stock for each share of its stock. The agreement includes representations, warranties, and conditions precedent, with obligations for consents, approvals, and filings, including SEC filings and regulatory approvals, prior to closing.
INDV
Indivior Pharmaceuticals, Inc. reported third-quarter 2026 financial results, with total net revenue of $356 million, up 13% year-over-year, and record quarterly SUBLOCADE net revenue of $267 million, up 22% year-over-year. The company achieved record quarterly net income of $137 million and non-GAAP net income of $161 million, with adjusted EBITDA of $211 million, up 76% year-over-year. Indivior is on track to close its merger with Supernus Pharmaceuticals, Inc. on November 2, 2026, creating a leading CNS-focused biopharmaceutical company.
PWR
Quanta Services, Inc. reported record third-quarter 2026 revenues of $12.01 billion, up from $7.63 billion in the same period of 2025, with GAAP diluted EPS rising to $4.55 from $2.24. Adjusted diluted EPS increased to $6.06, while net income attributable to common stock reached $694.9 million, or $4.55 per share. The company's total backlog hit a record $63.7 billion, and it issued $2.00 billion in senior notes in August 2026.
AOS
A. O. Smith Corporation reported third-quarter 2026 results, with sales of $940.5 million, a slight decrease from $942.5 million in 2025, and net earnings of $126.3 million, down from $132.0 million. The North America segment saw a 3% sales increase, driven by Leonard Valve acquisition sales and boiler sales growth, while the Rest of World segment experienced a 7% decline, primarily due to weakness in China's consumer appliance market. The company announced definitive agreements to acquire an 81% interest in its China business, with operations expected to close in the first half of 2027, and updated its 2026 full-year guidance to project net sales growth, excluding China, of approximately 4%.
KIM-PM
Kimco Realty Corporation reported third-quarter 2026 results, with net income available to common shareholders per diluted share rising to $0.41 from $0.19 the previous year, driven by $122.4 million in gains from property sales. The company achieved record portfolio occupancy of 96.6% and completed the sale of The Witmer for $211.5 million. Kimco Realty also repurchased $150 million of common stock and $74 million of preferred stock, resulting in a net cash increase of $114.6 million from capital market activities.
LVWR-WT
LiveWire Group, Inc. reported a 38% increase in consolidated revenue for the third quarter of 2026, driven by higher unit sales in the Electric Motorcycle and STACYC segments. Adjusted EBITDA improved to negative $14.7 million from negative $16.5 million year-over-year, while net cash used by operating activities decreased by 16% to $38.3 million. The company's net loss was $18.6 million, with a restructuring committee formed to explore strategic alternatives, appointing Roy Gallagher as Chief Restructuring Officer.
FTI
TechnipFMC plc reported third-quarter 2026 results, with total revenue of $2,895.8 million, up 4.8% sequentially, and net income of $418.4 million, or $1.05 per diluted share, marking a 15.4% increase in net income and a 40% rise in adjusted earnings per share from the prior quarter. The Subsea segment saw revenue of $2,600 million, a 4.5% increase, and operating profit of $522.6 million, up 7.4%, with adjusted EBITDA of $611.6 million, a 6% rise, and a margin of 23.5%. Subsea inbound orders totaled $2,051.5 million, with a book-to-bill ratio of 0.8x, and backlog reached $15,487 million after adjusting for a $202 million foreign exchange impact.
PBF
PBF Energy Inc. reported a third-quarter 2026 income from operations of $2,100.9 million, excluding special items, and net income of $1,543.3 million, up from $171.7 million in the same quarter of 2025. The company increased its quarterly dividend by 18% to $0.325 per share and announced the Martinez refinery's return to full operations in May 2026, with insurance coverage for restoration costs subject to a $30 million deductible and retentions. PBF Energy also updated its 2026 capital expenditure guidance to $825-$875 million, excluding Martinez rebuild costs, and reduced net debt by approximately 150% through refinancing activities, including the issuance of 2032 Exchangeable Notes.
XPO
XPO, Inc. reported third-quarter 2026 results, showcasing a significant earnings boost with diluted earnings per share rising to $1.53 from $0.68 in 2025. Revenue climbed 12.4% to $2.37 billion, while operating income surged 75.6% to $288 million. Adjusted operating income and EBITDA both increased by 26.6%, reaching $433 million, and net income soared 120.7% to $181 million.
TXT
Textron Inc. reported third-quarter 2026 results, with income from continuing operations rising to $1.56 per share from $1.31, and adjusted income increasing to $1.76 per share from $1.55. Revenues climbed 4% to $3.8 billion, driven by higher jet deliveries at Textron Aviation and program execution at Textron Systems, despite a 9% decrease in Bell's revenues. The company raised its full-year adjusted EPS outlook to $6.55-$6.65 and cash flow outlook to $800-$900 million, reflecting positive impacts from Congressional approval for the MV-75 Cheyenne program and associated contract modifications.
RSTRF
Restaurant Brands International Inc. reported third-quarter 2026 results, showing a 6.2% year-over-year growth in system-wide sales, with International Global Comparable Sales increasing by 3.8%. The company returned $1.3 billion to shareholders through dividends and share repurchases. Adjusted Operating Income grew 6.7% year-over-year, reaching $737 million, while Adjusted EBITDA stood at $829 million. The company also announced the acquisition of Burger King China and a joint venture with CPE Alder Investment Limited, leading to the deconsolidation of BK China and recognition of franchise revenue in the INTL segment.
BFLY
Butterfly Network, Inc. reported third-quarter 2026 financial results, surpassing the high end of revenue and adjusted EBITDA guidance. The company achieved quarterly revenue of $32.6 million, driven by Embedded revenue, and recorded a record gross margin of 73%. Management raised full-year revenue and adjusted EBITDA guidance, highlighting strategic expansions such as adding three BCI partners, closing significant enterprise deals, and advancing product development.
FTAIM
FTAI Aviation Ltd. reported a robust third quarter 2026 performance, with net income attributable to shareholders rising 26.8% to $149.1 million and adjusted EBITDA increasing 14.8% to $348.3 million. The company completed a $500 million accelerated share repurchase, doubling the authorization to $1.0 billion, and repurchased $80 million of shares since September. Aerospace Products generated $910.0 million in revenue, up 76% from Q3 2025, while Aviation Leasing closed 212 of 301 committed aircraft and entered a joint venture for a mobile combined cycle add-on.
LHX
L3Harris Technologies reported strong third-quarter 2026 results, with revenue of $6.1 billion, up 7% year-over-year, and organic growth of 9%. The company achieved a record backlog of $53.2 billion and a book-to-bill ratio of 3.2x, driven by robust demand across its key segments. Operating income margin increased to 13.0%, while diluted EPS rose 33% to $3.28, and free cash flow reached $1.3 billion, a 195% increase over the prior year.
SILC
Silicom Ltd. reported a 71% increase in Q3 2026 revenue to $26.7 million, with a GAAP net loss of $0.3 million, an 88% improvement from the previous year. For the first nine months, revenues rose 55% to $69.6 million, with a GAAP net loss of $4.8 million, a 46% improvement. The company raised its full-year revenue projections to $96-$98 million, reflecting 57% year-over-year growth, driven by strong Design Win momentum.
BTQ
BTQ Technologies Corp. has expanded access to its large-scale quantum emulator, MIMIQ, to over 35,000 developers via qBraid's platform. This integration allows developers to simulate circuits with thousands of qubits and millions of gates, overcoming the memory limitations of standard simulators. By leveraging QPerfect's open-source library and Apache License 2.0, developers can now easily submit circuits to MIMIQ from qBraid Runtime, enhancing the design and validation of complex quantum algorithms.
VRAX
Virax Biolabs Group Limited has entered into non-exclusive distribution agreements with AmyJet Scientific Inc., Jiangsu Real-Gen Biotechnology Co., Ltd., and Zhixi (Shanghai) Biotechnology Co., Ltd. for its ImmuneSelect research-use immune profiling products. These agreements establish distribution channels across six mainland Chinese markets, including Beijing, Shanghai, Suzhou, and Wuhan, with local partners managing sales and customer engagement. The focus is on ELISpot assay plates and antigen-specific peptide pools, enhancing Virax's existing operations in China and complementing its Southeast Asian supply agreement with Fosun Diagnostics.
ACB
Aurora Cannabis Inc. announced plans to host a second-quarter 2027 investor conference call on November 12, 2026, to discuss upcoming financial results. The company rejected Curaleaf's hostile bid, advising shareholders to refrain from tendering shares, with more details at www.ProtectAurora.com. Aurora Cannabis also disclosed its intent to submit fiscal 2027 second-quarter financial statements before the SEC filing deadline, adhering to Rule 13a-16(b) or Form 20-F/40-F requirements.
VFSWW
VinFast Auto Ltd. reported preliminary global deliveries of 82,580 electric vehicles in Q3 2026, marking a 116% year-over-year increase. The company also delivered 284,831 e-scooters and e-bikes, with a 137% growth, predominantly in Vietnam. Founder Pham Nhat Vuong contributed approximately US$436.4 million to VinFast Vietnam Joint Stock Company, with financial results for Q3 2026 to be released on December 2, 2026.
FRFFF
Fairfax Financial Holdings Limited completed the sale of its 80% equity interest in Eurolife FFH Insurance Group Holdings S.A. to Eurobank S.A. for approximately €813 million. This transaction represents a strategic realignment within Fairfax's insurance operations, potentially affecting its financial metrics and SEC compliance. The deal underscores Fairfax's ongoing efforts to optimize its business portfolio.
MEOBF
Mesoblast Limited reported a 44% increase in net revenues and an 86% improvement in net operational cash spend for the first fiscal quarter ended September 30, 2026. The company completed the MSB-DR004 Phase 3 trial for rexlemestrocel-L and received a positive meeting with the FDA regarding its Biologics License Application for preventing gastrointestinal bleeding in end-stage heart failure patients. Mesoblast had US$99 million in cash and US$28 million in RYONCIL net revenue, marking a 44% increase from the prior year.
CDLR
Cadeler A/S announced preliminary results of its voluntary share exchange offer by Cadeler plc, achieving an acceptance rate of approximately 92.02% of outstanding shares. The offer, which concluded on October 28, 2026, saw 355 million shares tendered, with each shareholder set to receive equivalent Cadeler plc shares. Cadeler plc plans to finalize the offer by November 2, 2026, and proceed with a compulsory acquisition of remaining shares, supported by a financing arrangement with DNB Bank ASA. Trading of Cadeler ADSs on NYSE is expected to be suspended before November 5, 2026, with delisting following 10 days later.
ASX
ASE Technology Holding Co., Ltd. reported a 28% year-over-year increase in consolidated net revenues to NT$244.161 billion for Q3 2026, driven by strong growth in ATM (20%) and EMS (42%) segments. The company's gross profit margin improved to 22.1% from 17.1% in Q3 2025, with gross profit rising 34% YoY. Operating income surged 57% YoY to NT$33.142 billion, reflecting enhanced operational efficiency.
SKHY
SK hynix Inc. filed a Form 6-K for October 2026, confirming its status as a foreign private issuer under the Securities Exchange Act of 1934. The company, headquartered in Icheon-si, Gyeonggi-do, Korea, noted that rumors about its U.S. subsidiary, Solidigm, considering a Won 60 trillion investment for a new NAND flash memory facility in the U.S. were under review, with no decisions made as of the report date. Further disclosure will occur upon confirmation of specific details or within one month of the report date.
WOPEF
Woodside Energy Group Ltd has secured a 20-year supply agreement with QatarEnergy for up to 3 million tonnes per annum of LNG from its Louisiana LNG Project. The deal, targeting first LNG in 2029, ensures sustained revenue certainty for a significant portion of the project's production. Woodside will supply LNG on a free-on-board basis, starting with Train 2 and increasing to full capacity with Train 3, complementing the previously announced Uniper agreement to enhance global energy delivery.
AAUC
Allied Gold Corporation advances toward production startup at its Kurmuk Mine in Ethiopia, with wet commissioning underway and ore stockpiles nearing planned levels. The company anticipates introducing ore into the circuit this week, targeting first gold production soon, with total production expected between 25,000 to 35,000 gold ounces through November and December. Allied Gold projects quarterly production of 55,000 to 65,000 gold ounces in 2027 and approximately 300,000 gold ounces annually by 2028, bolstered by a cooperative agreement with local stakeholders to explore new areas.
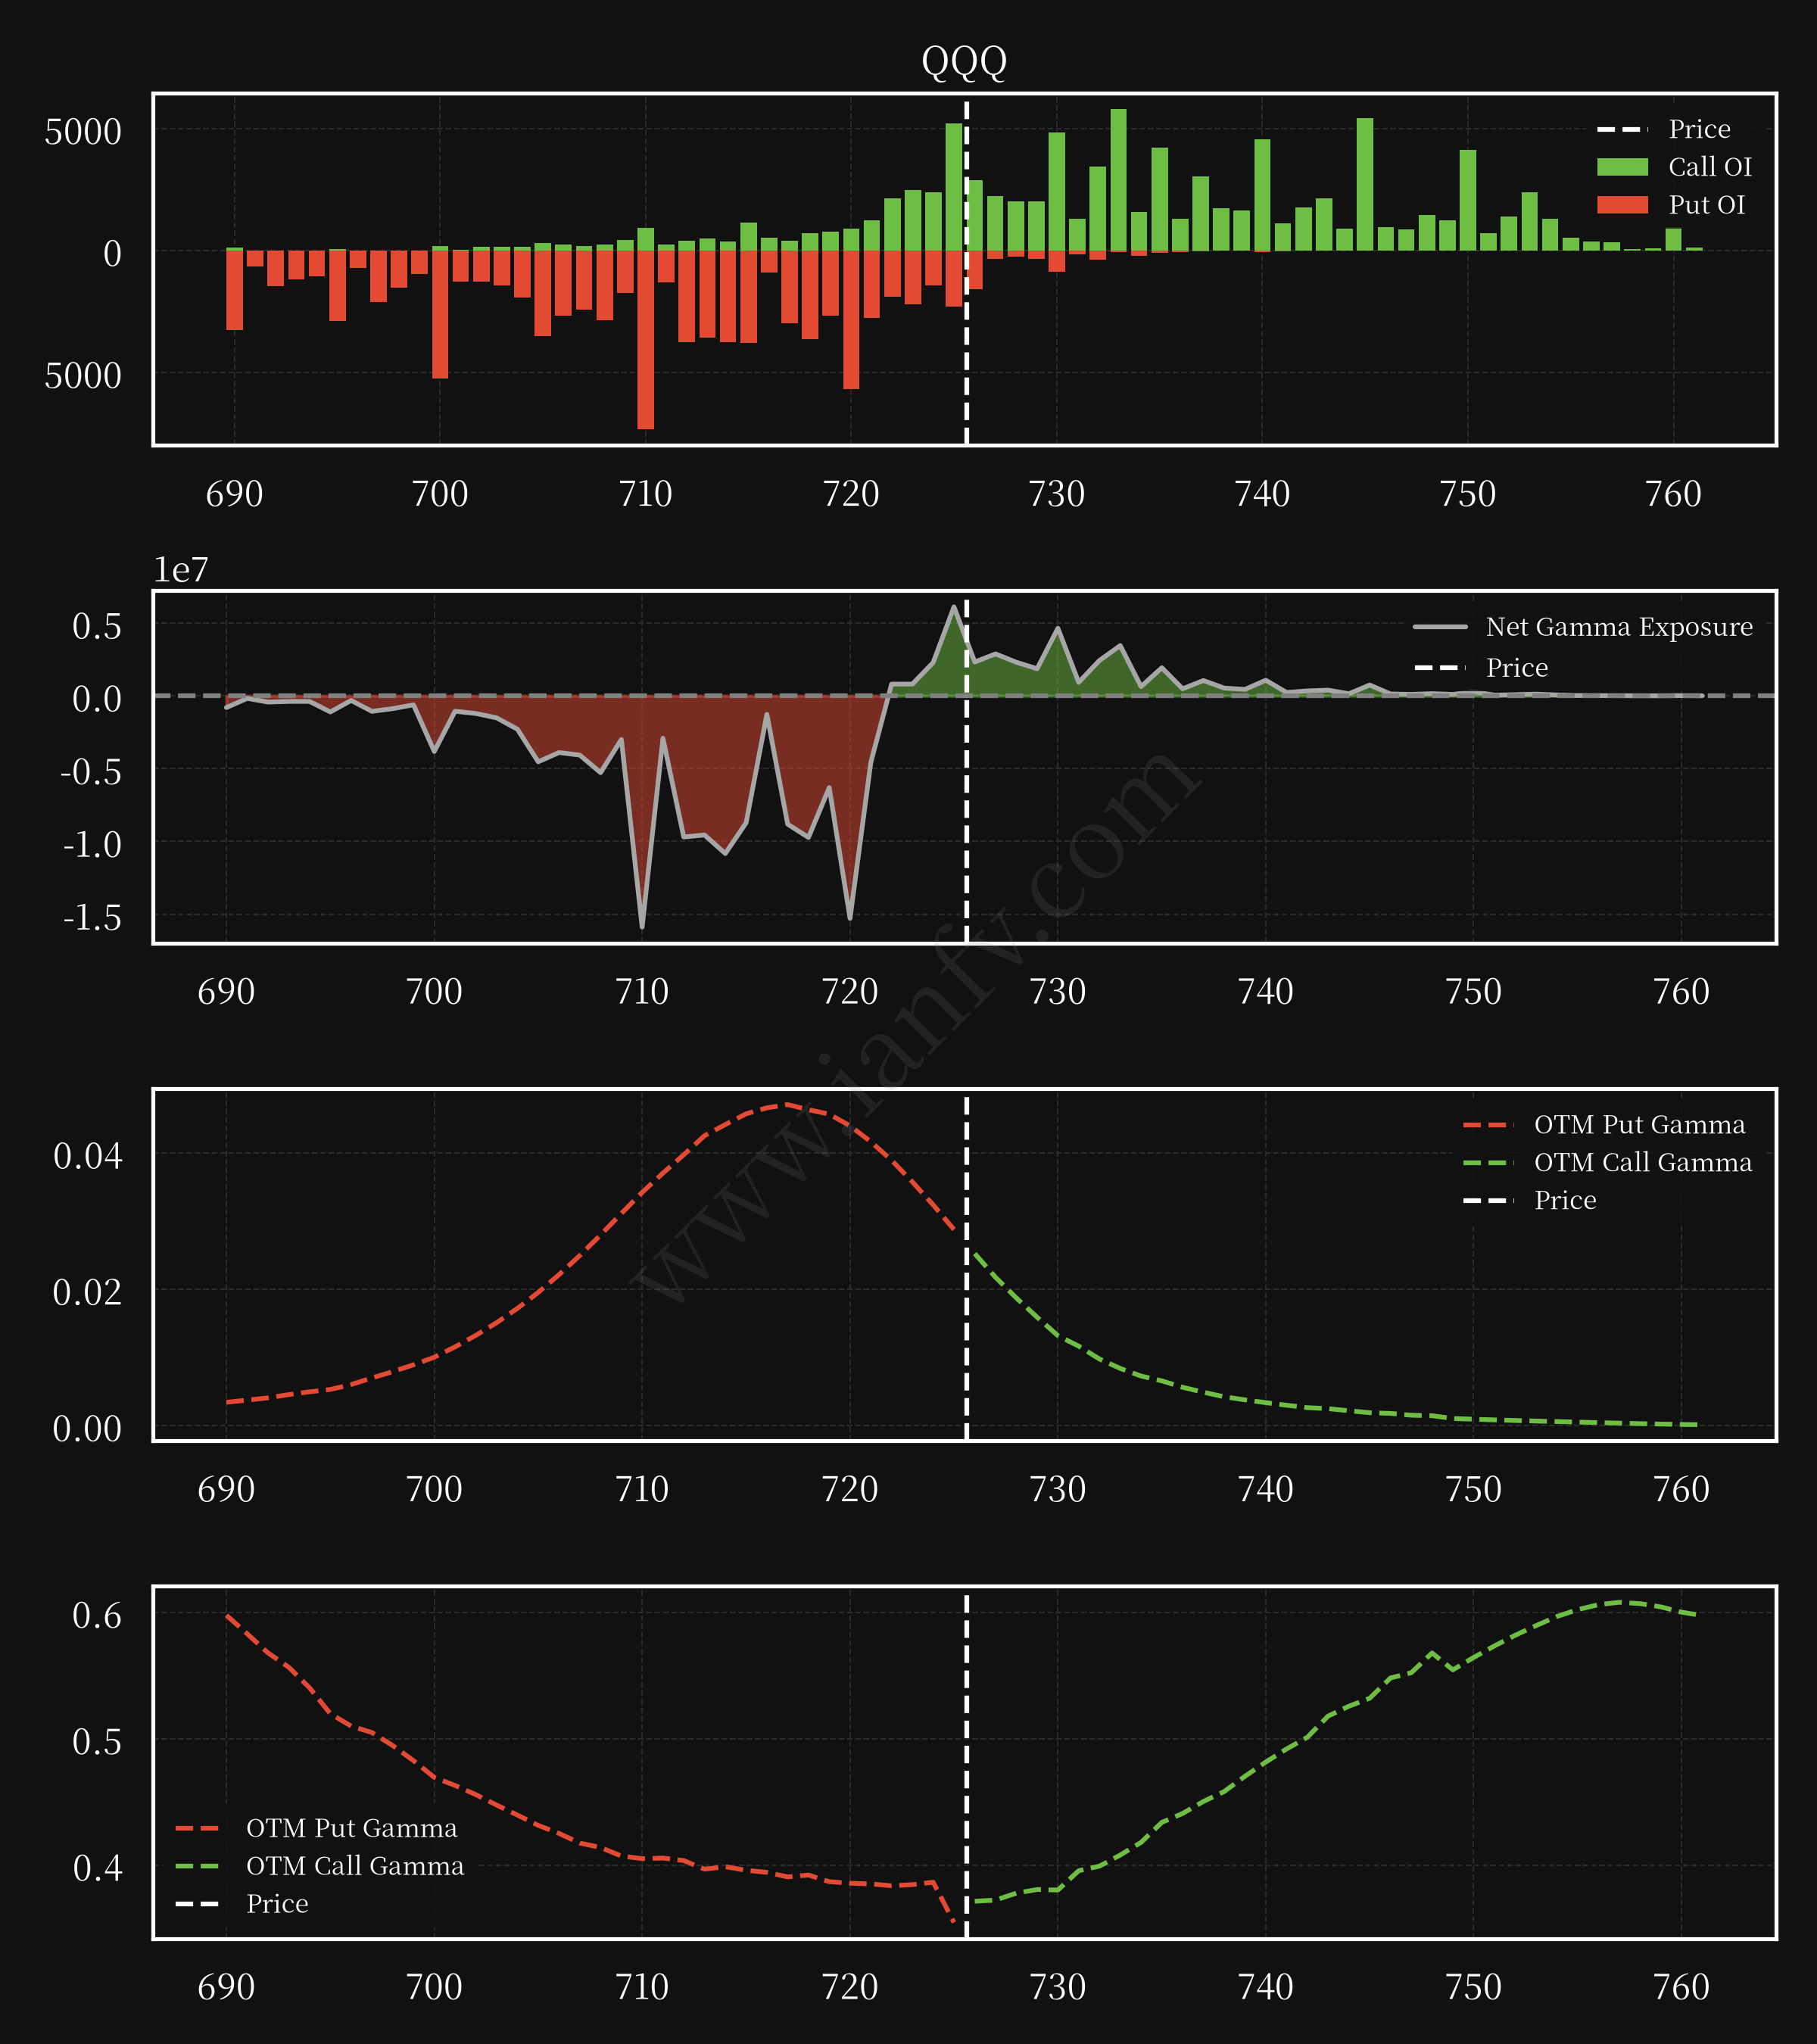
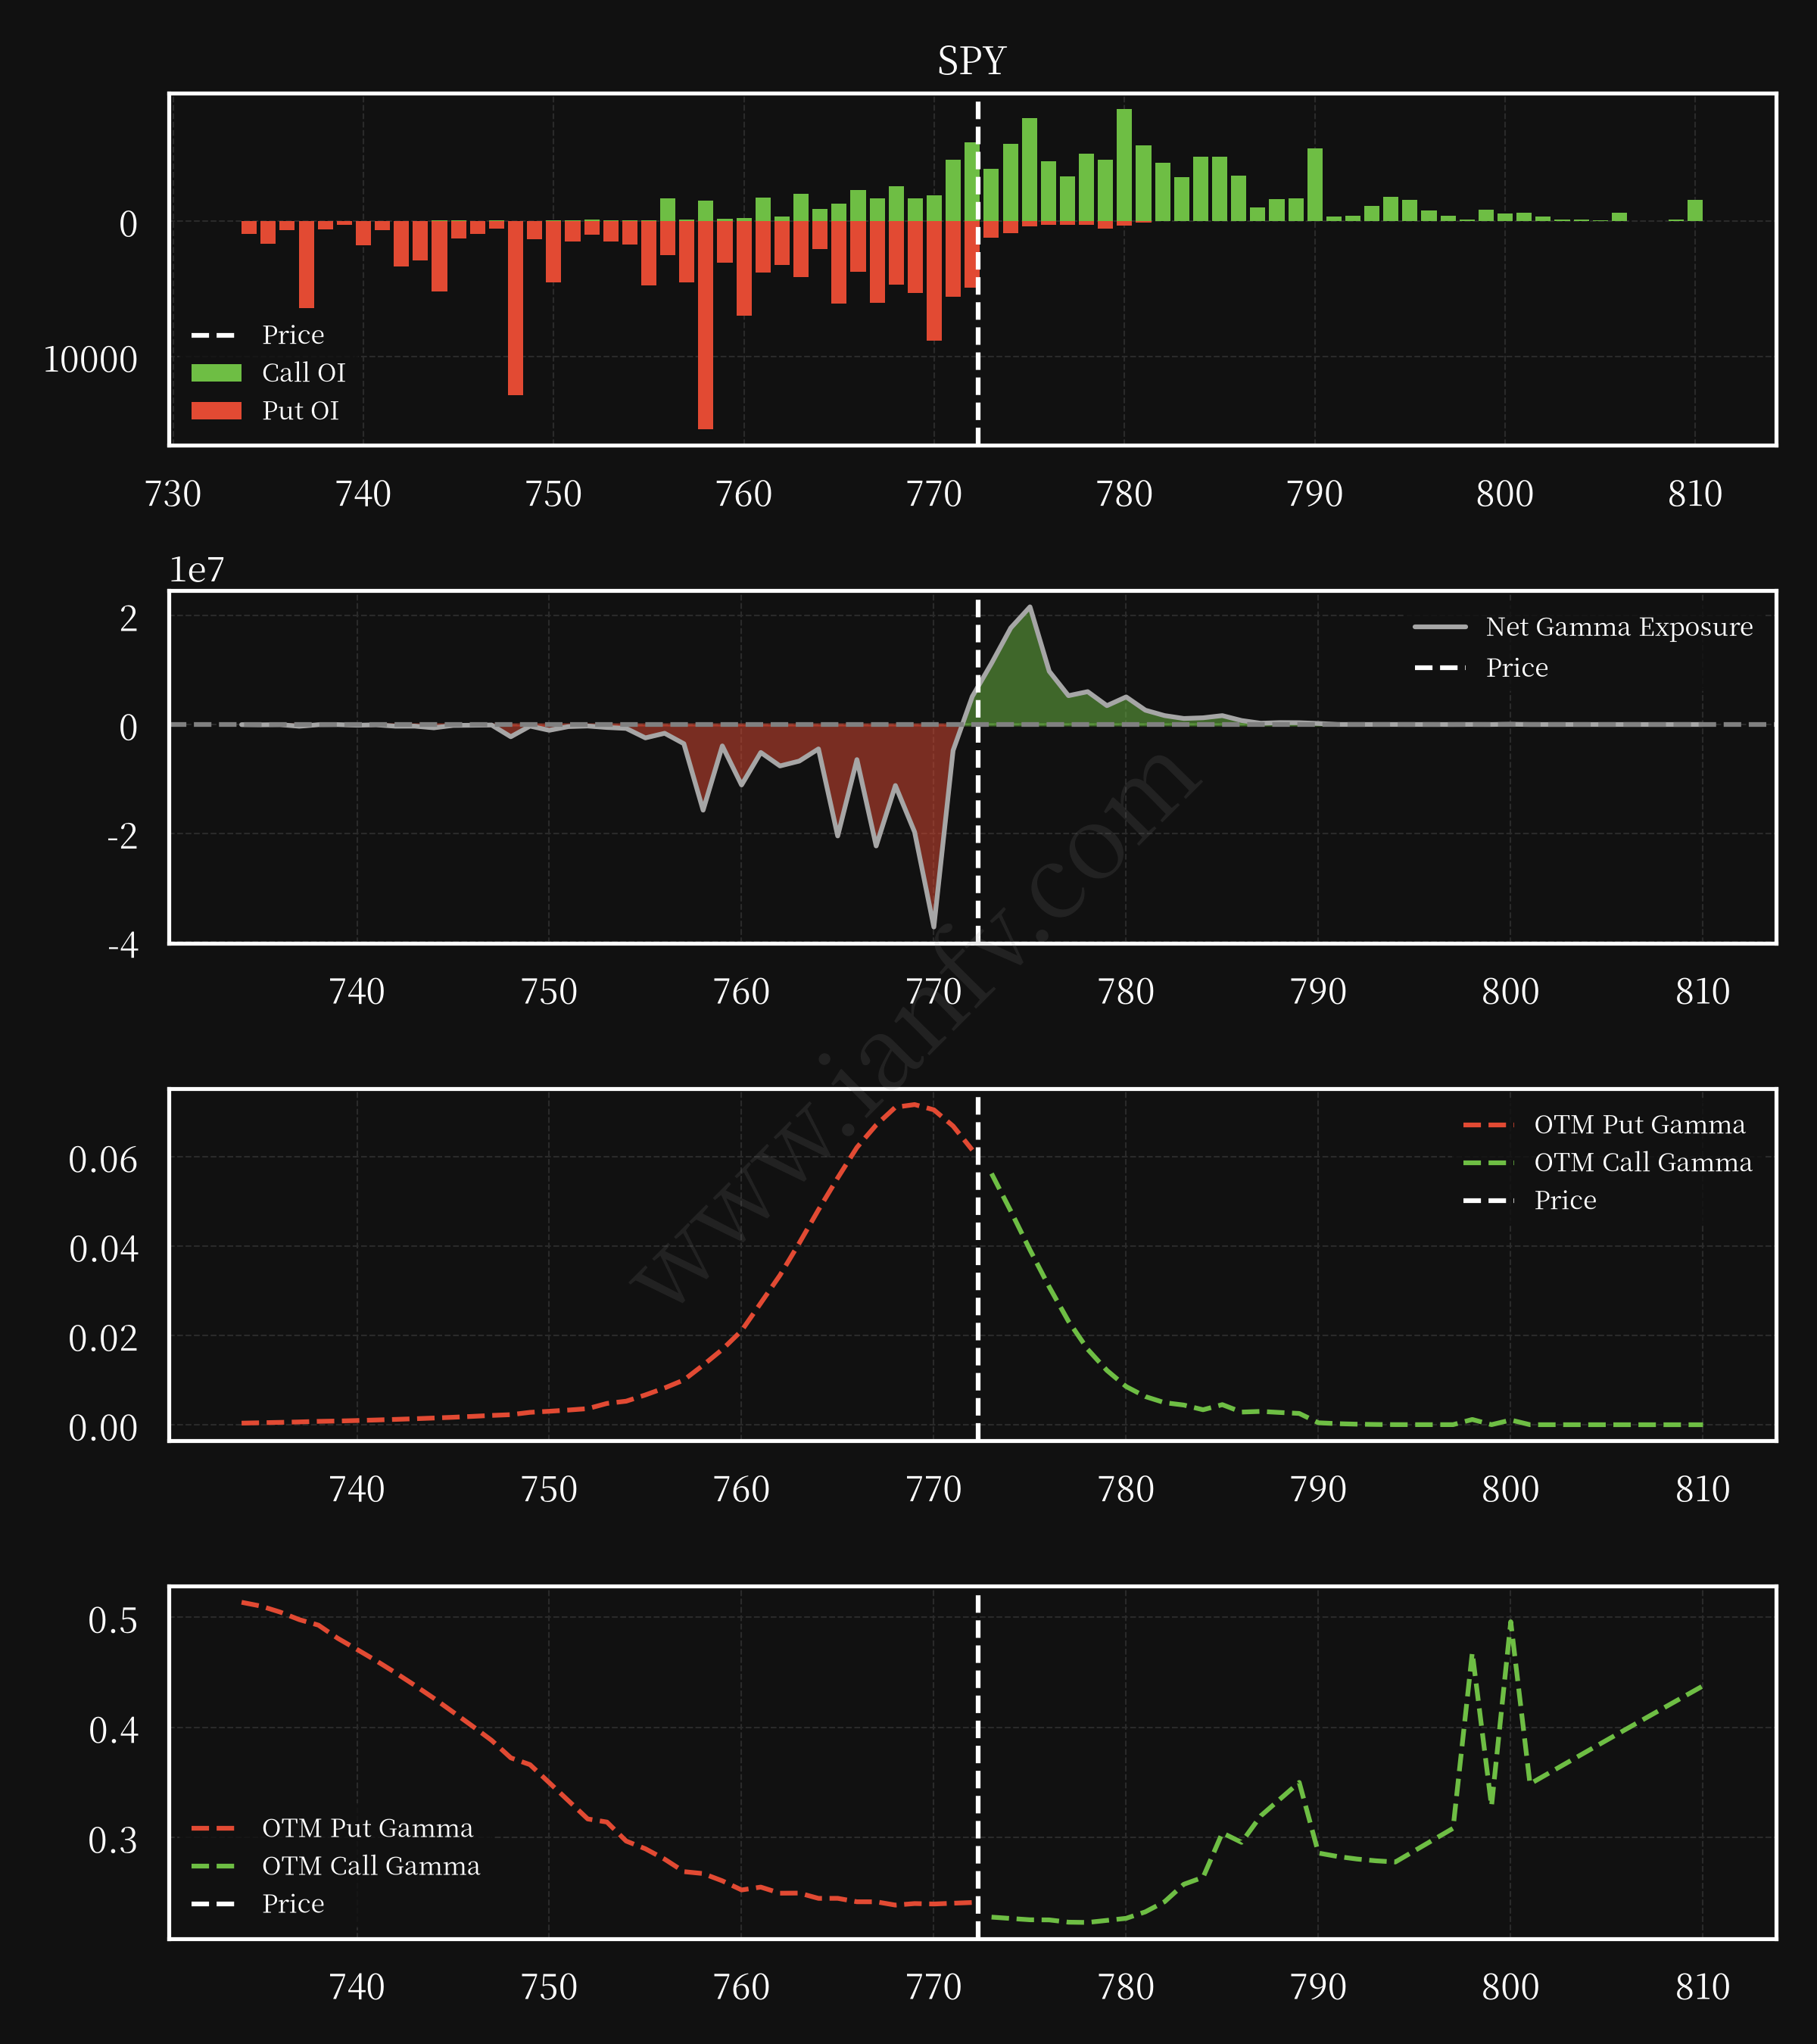
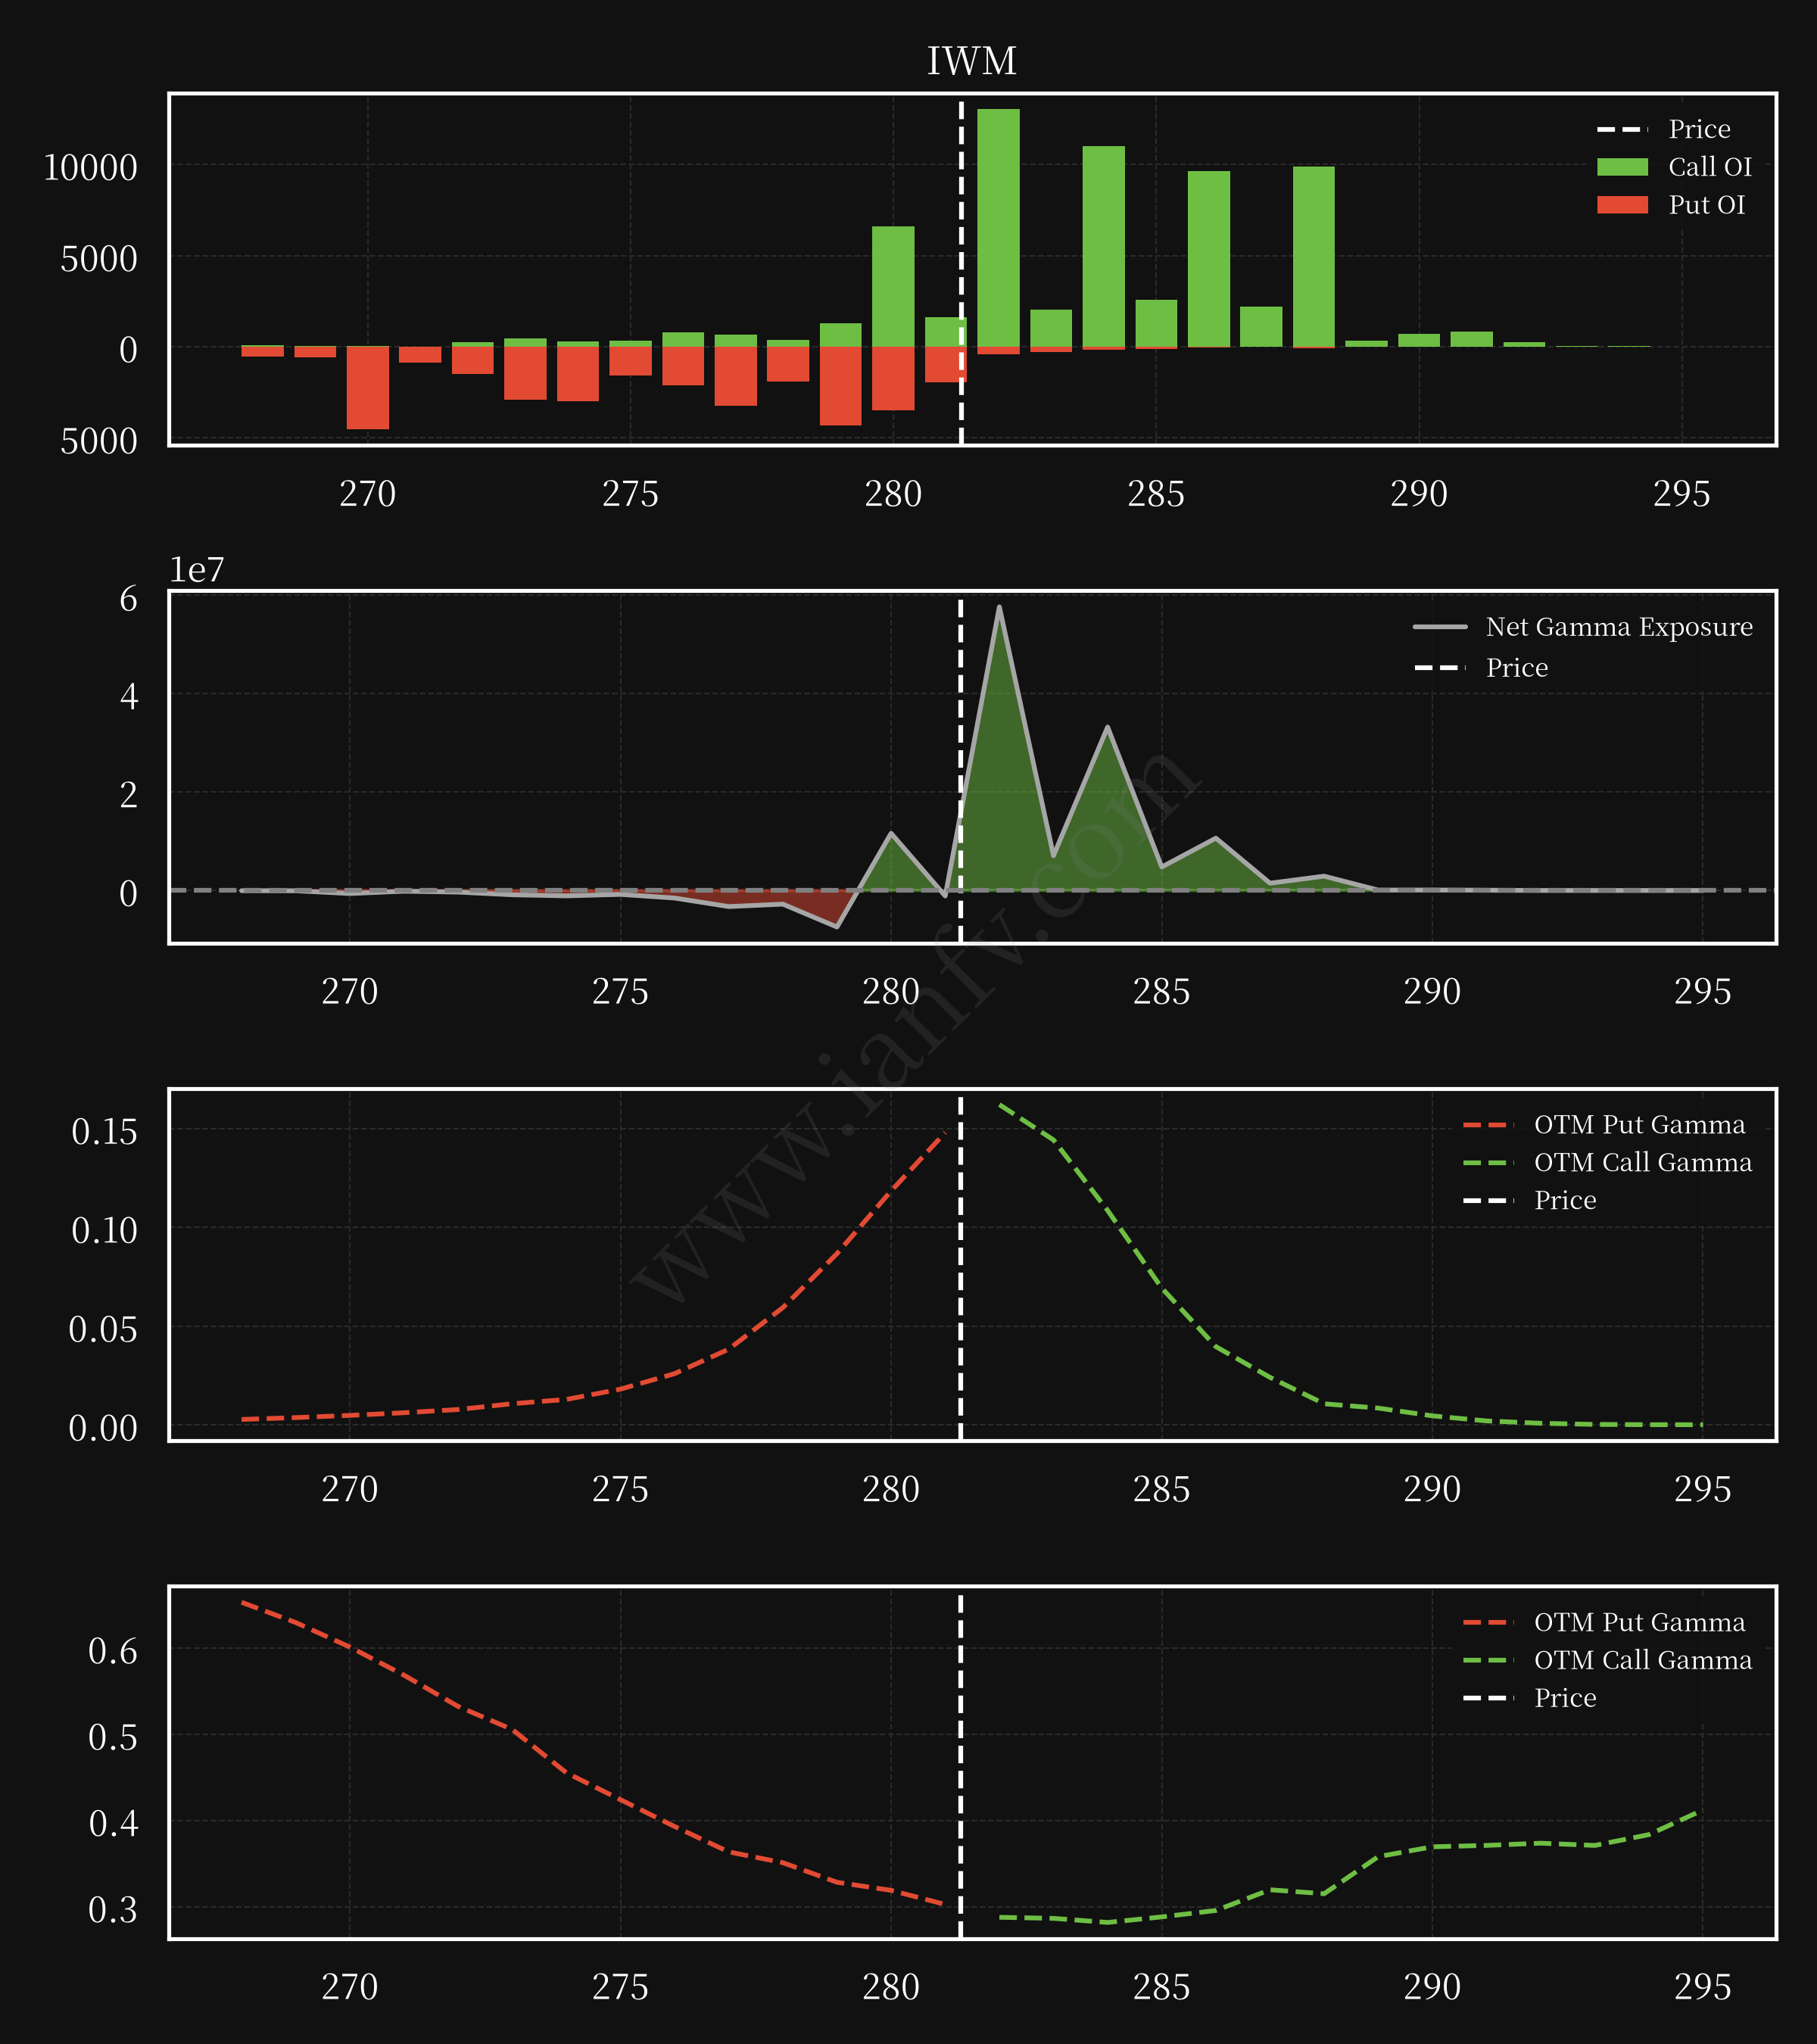
Pre-Market Options Data